Study population
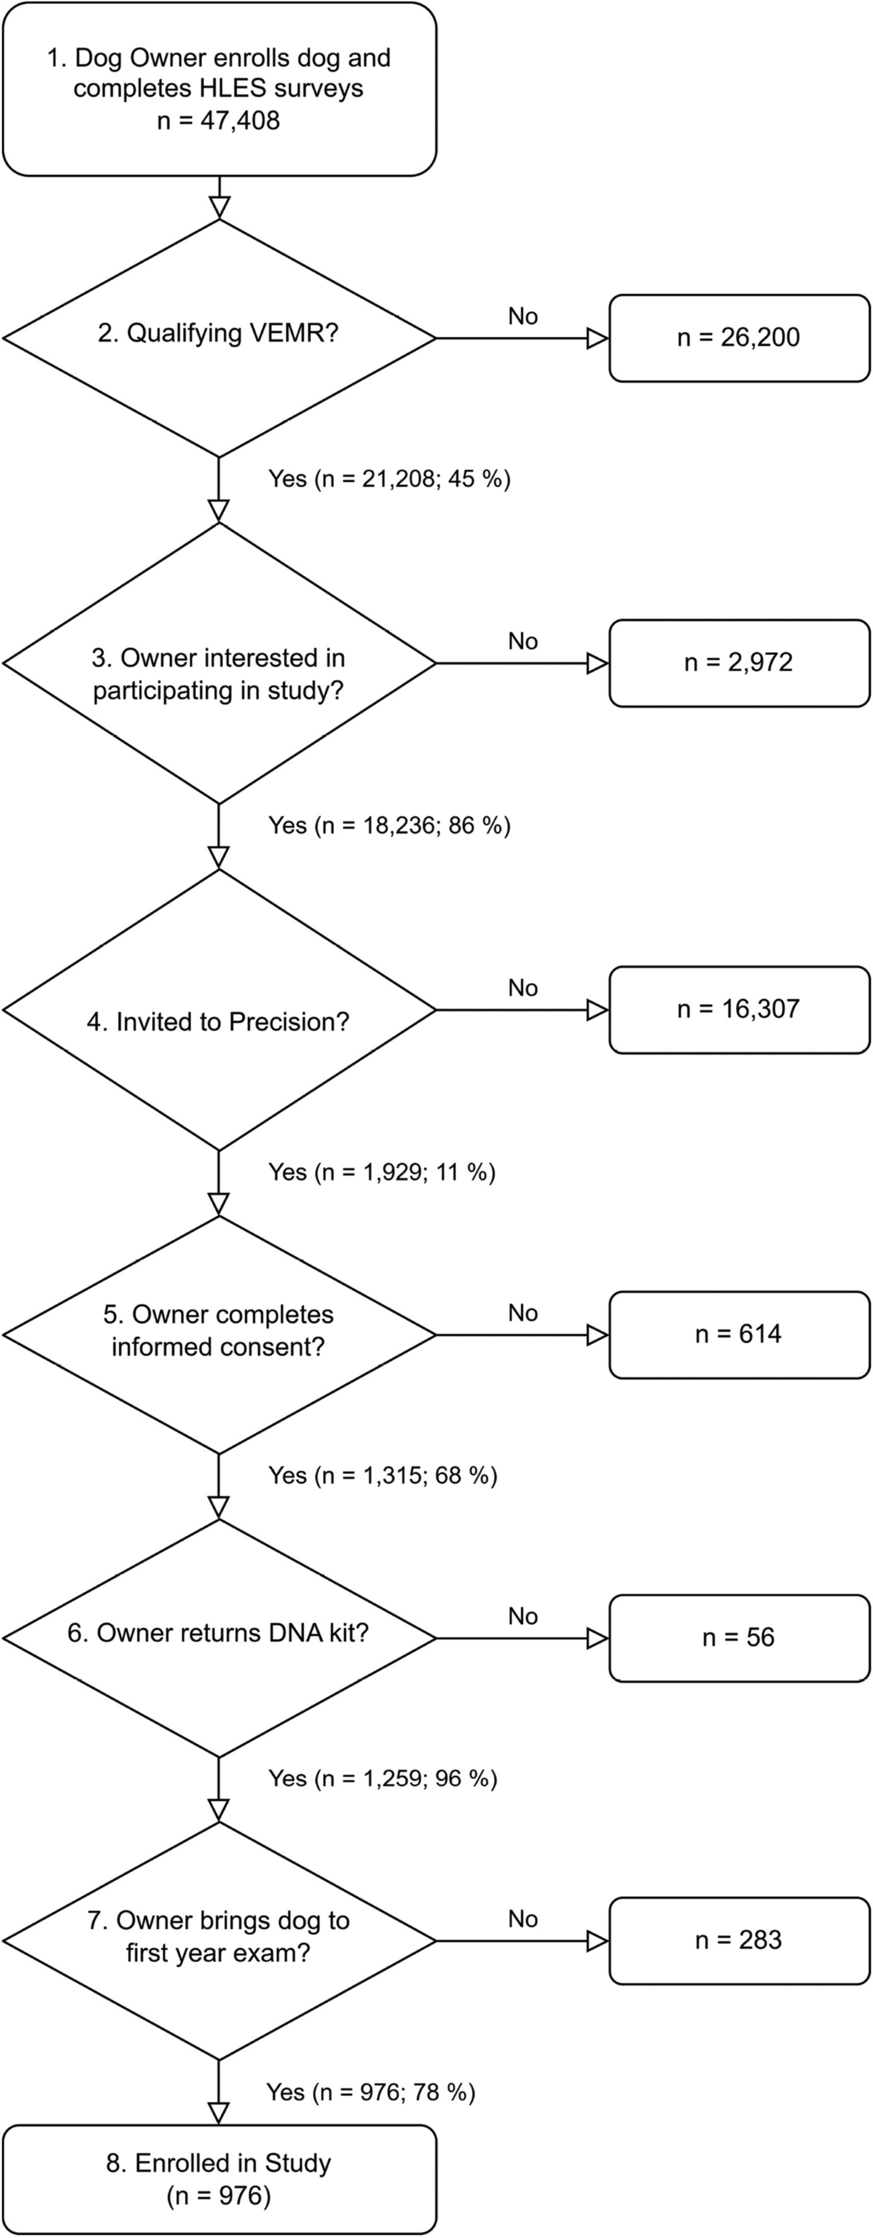
This study uses data from patients admitted to the Jeroen Bosch Hospital and the Bernhoven Hospital between March and May 2020 during the first wave of COVID-19. The flow chart of inclusion can be seen in Supplementary Fig. 1. All patients hospitalized with a suspected COVID-19 infection were screened for eligibility. Patients were included if they were 18 years or older and if the COVID-19 diagnosis was confirmed with a positive polymerase chain reaction (PCR) test via a nasopharyngeal swab or if a clinical diagnosis was made (based on chest imaging, symptom profile, exposure and exclusion of other causes. This study was not subject to the Medical Research Involving Human Subjects Act (WMO) in the Netherlands, and was reviewed by the institutional review board (IRB) of the Radboud university medical center (file numbers 2020–2923 and 2020–6344). According to the IRB only oral consent was required. After information was provided by the local investigator, oral informed consent was obtained from all of the patients or their relatives included in the cohort and documented in their electronic medical records. Metabolomic profiling was performed on the blood samples of 357 patients. After excluding 11 samples from analysis due to low sample quality and failed profiling, the final study population consisted of data from 346 patients. For the survival analysis, five additional cases were omitted due to missing or unreliable survival time data. Patients older than 60 were contacted by phone between 2 and 2,5 years after admission and asked to give informed oral consent to participate in a follow-up questionnaire about their long-term recovery. Of the 255 eligible patients, 97 gave oral consent and participated in the telephone follow-up.
Metabolic profiling
Blood samples were collected within 24 h of admission and stored at −80 °C in both hospitals until metabolic profile analysis. The metabolomic profile was measured using a high-throughput 1H-NMR platform from Nightingale Health Ltd, platform version 2020. The high throughput nature of 1H-NMR metabolomics provides the opportunity to obtain rich metabolic profiles in an affordable and reproducible manner at a biobank scale level. The Nightingale 1H-NMR platform is often used as a commercial supplier in research and to measure metabolic profiles in large cohort studies. This panel quantifies 250 metabolic features, including cholesterols, triglycerides, fatty acids, fatty acid ratios, apolipoproteins, amino acids, glycolysis-related metabolites, fluid balance, and inflammation-related markers. Many of the features are correlated which is why many studies focus on about 62 of the more independent features. In addition, 39 of the 250 metabolic features are clinically and analytically validated, allowing direct comparison to the results of any other clinically and analytically validated laboratory method. The ‘Infectious Disease Score’ was based on 37 metabolic features, and after selection comprises 25 metabolic features in an algorithm optimized for predicting the risk for severe pneumonia and COVID-19 in the general population of the UK [6]. The ‘MetaboHealth’ score was based on 63 biomarkers, and after selection comprises 14 metabolic features optimized for the prediction of mortality in multiple population-based cohort studies in the EU [5]. MetaboAge comprises 62 metabolic features optimized for predicting chronological age in multiple population and patient-based Dutch cohorts (BBMRI.Nl) [7]. Furthermore, 10 features were shared between all three metabolic scores. The MetaboHealth, MetaboAge, and Infectious Disease Score were generated such that a higher score indicates poorer health outcomes (increased mortality risk, higher biological age, and higher infectious disease risk, respectively). We calculated all scores, for ‘MetaboAge’ version 2.0, using the R package MiMIR [7, 12, 13]. To obtain the age-independent part of the MetaboAge score (ΔMetaboAge) we regressed out chronological age. Finally, we standardized all the metabolic features and scores to allow direct comparisons.
Outcome measures
The in-hospital disease course was composed as an ordered categorical variable based on four potential outcomes during hospitalization: (1, ‘mild’) admission and recovery without complications or additional treatments; (2, ‘moderate’) receiving oxygen treatment via an oxygenator or ventilator during hospitalization; (3, ‘severe’) suffering from COVID-19 related complications during hospital stay; (4, ‘fatal’) in-hospital or palliative care mortality. These categories were mutually exclusive, and patients were categorized into the worst outcome category that applied to them. Information on COVID-19-related complications was derived from the medical records. These included pulmonary embolism, acute kidney injury, liver function abnormalities, diarrhea, and delirium [14,15,16,17,18].
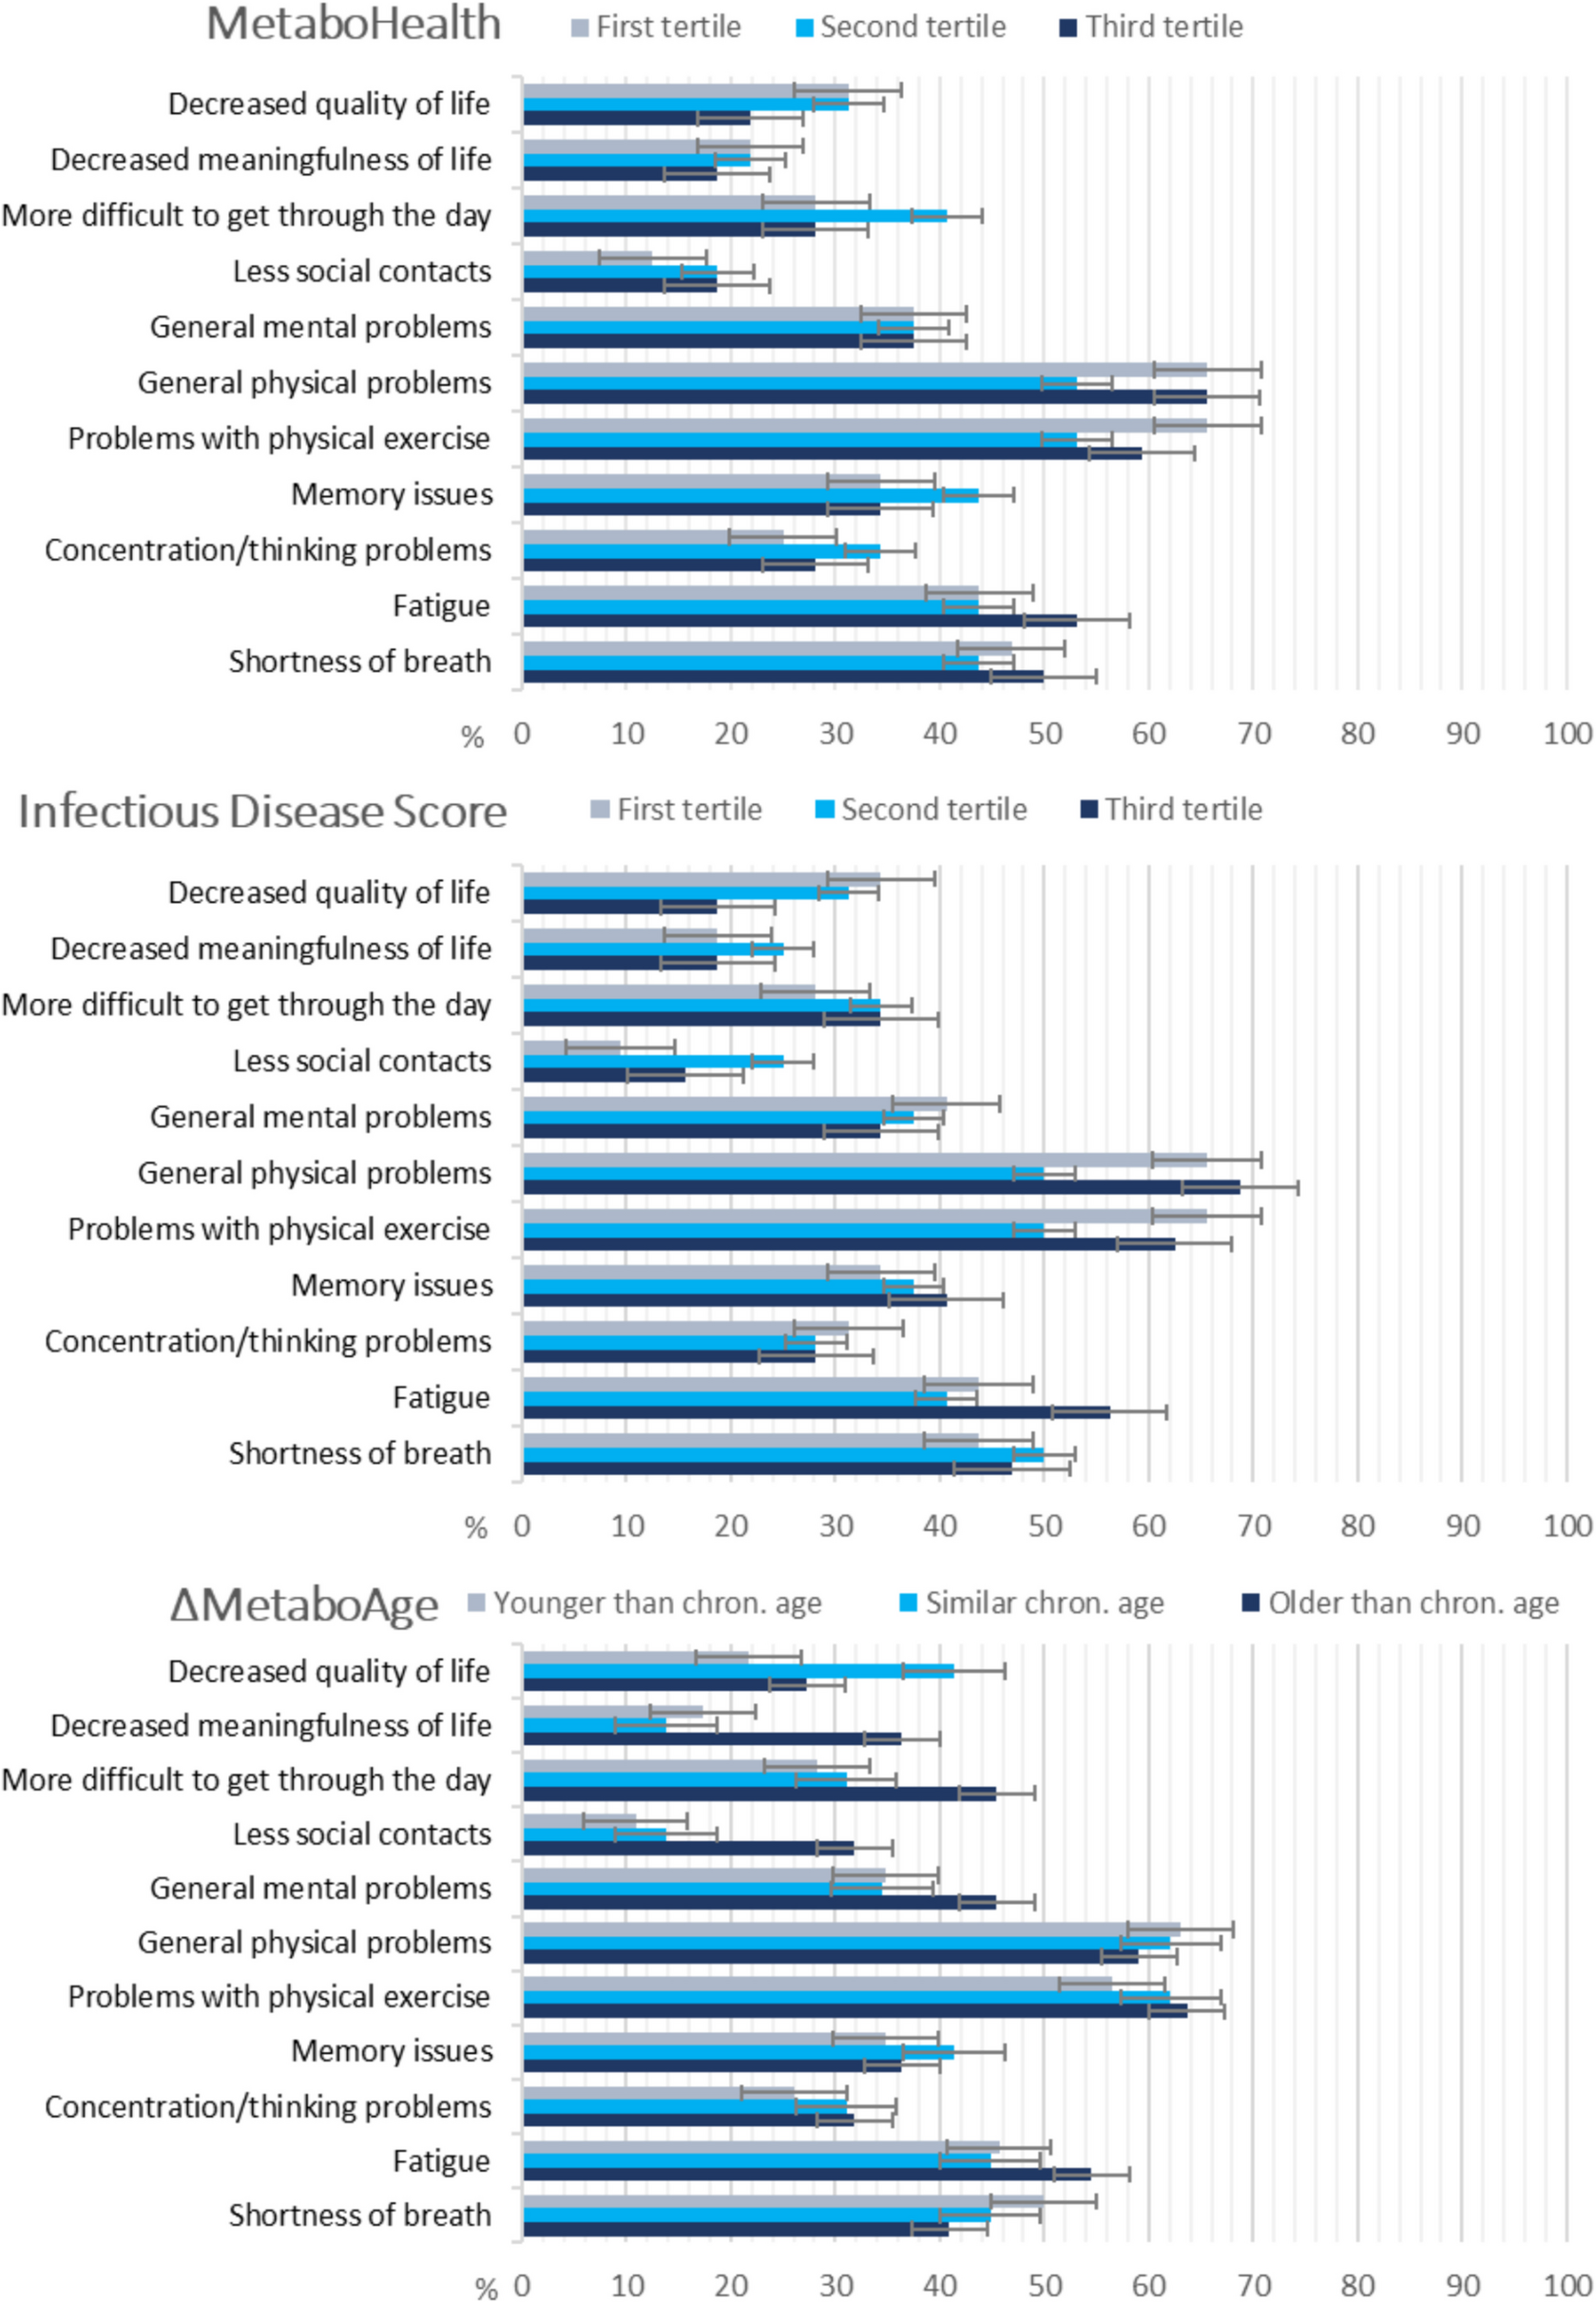
Patients who gave oral consent to participate in the telephone questionnaires between 2 and 2,5 years after admission were asked about daily functioning, health problems after COVID-19 and admission, and current mental, social, and physical health. Health problems after COVID-19 include shortness of breath, fatigue, concentration or thinking problems, memory issues, and problems with physical exercise. Patients were listed as having these health problems if they experienced them as new or worsened symptoms after COVID-19 infection. Patients were asked via a standardized questionnaire if they experienced worsening of conditions concerning their physical, social, or mental conditions post-COVID-19 as compared to pre-COVID-19. This questionnaire was standardized across cohorts participating in the COVID-19 Outcomes in Older People (COOP) study and used existing validated questionnaires were possible supplemented with customized items relevant for the aims of this COOP study.
For the survival analysis, mortality was defined as the time in days from admission until the date of death. The date of admission, the date of final contact, and the date of death used for the analysis were derived from the electronic medical records. Patients were censored after they were successfully contacted for the telephone questionnaires. Patients younger than 60, for whom no post-discharge mortality data were collected, were censored at the date of discharge.
Descriptive variables
Routine care data were extracted from the electronic medical records and entered into an electronic case report form (Castor Electronic Data Capture) based on the ISARIC-WHO COVID-19 CRF [19]. Information collected included demographics, symptoms at admission, laboratory parameters at admission, complications during admission, comorbidities, medication, supportive treatment during admission, and reasons for discharge. Patients were listed as immunocompromised if they suffered from hematological malignancies, auto-immune disease, and/or HIV/AIDS, received stem cell or organ transplantation, or treatment with immunosuppressive medication at admission. The quick Sequential Organ Failure Assessment (qSOFA) score is based on respiratory rate, altered mentation, and systolic blood pressure. It was originally designed to evaluate septic patients, however, it can be used to predict mortality for other diseases [20, 21]. Chronic kidney disease includes chronic deterioration of kidney function whether or not requiring renal replacement therapy. Liver function abnormalities were levels aspartate aminotransferase (ASAT) or alanine aminotransferase (ALAT) five-fold above upper limit of normal levels. Acute kidney injury was defined as a > 25% decrease in eGFR or an eGFR < 60 ml/min. Fever was defined as a temperature higher than 38 °C. Blood pressure medicine includes Angiotensin II receptor blockers and ACE inhibitors. The Clinical Frailty Scale (CFS, range 1–9) was noted only for patients aged 60 or older and categorized as robust (1–3), pre-frail (4–6) and frail (7–9). Patients below the age of 60 were categorized as 1–3 [22, 23]. Obesity was defined as a body mass index (BMI) above 30 kg/m2. Restricting policies include non-ICU policy, or non-intubate policy and non-resuscitation policy.
Statistical analysis
To evaluate whether the two populations from the two hospitals can be assessed as one batch, t-distributed Stochastic Neighbor Embedding (t-SNE) was performed. No differences were observed between the populations [24]. Descriptive statistics were used to compare patients with ‘mild’ and ‘moderate’ in-hospital outcomes with patients with ‘severe’ and ‘fatal’ in-hospital outcomes.
Ordinal regression was conducted to examine the associations between metabolic features and scores with in-hospital disease course. The metabolic features that are clinically and analytically validated or used in the scores were selected for analysis. The proportional hazards assumption of the ordinal regression model was not met. Therefore, additional logistic regression models were used with the outcome in-hospital disease course dichotomized in three ways: ‘mild’ against ‘moderate’, ‘severe’, and ‘fatal’; ‘mild’ and ‘moderate’ against ‘severe’ and ‘fatal’; and ‘mild’, ‘moderate’, and ‘severe’ against ‘fatal’. As age may be an effect modifier, models were stratified by age (< 70 years and ≥ 70 years). The following variables were selected as confounders based on univariable associations with the exposure and outcomes and > 10% change in regression coefficient when added to the model: age, sex, qSOFA at admission, and hospital of admission. To check for multicollinearity, a correlation analysis between all of the confounders was performed and no significant correlations were found. To account for the multiple testing problem, Table 1 (29 tests) and Table 2 in Supplement (62 tests) were controlled for False Discovery Rate. Log-likelihood and Akaike Information Criterion (AIC) were calculated to compare the fit of the models.
Table 1 Clinical characteristics of patients admitted to the hospital with COVID-19 infectionTable 2 Association between metabolic features with in-hospital disease course and overall survival after COVID-19 hospitalizationDescriptive statistics were used to compare subgroups based on tertiles of the metabolic scores in terms of the long-term recovery outcomes. The subsample with available data on both metabolomics and these outcomes was too small to warrant more advanced statistical analyses. Statistical analyses were done using SPSS version 25.0 and 29.0 (IBM Corp. Released 2017 & 2022. IBM SPSS Statistics for Windows, Version 25.0. & 29.0. Armonk, NY: IBM Corp.).
To examine the association between the selected metabolic features and scores and mortality, Cox proportional hazards regression was used in R (4.3.1) with the survival and survminer packages. Age and sex were included as confounders. Each metabolic score was analyzed both as a continuous variable (z-score standardized) and categorized into tertiles. To assess potential bias introduced by the censoring of younger patients at discharge, we conducted sensitivity analyses excluding patients younger than 60 entirely to assess whether their inclusion affected results.


Comments (0)