
Remember me


The present study aimed at determining the test–retest reliability of commonly used neuromuscular, morphological, and functional test measures in a sample of middle-aged and older participants who presented with a wide range of functional abilities. Our main analysis suggests that most of these measures are sufficiently reliable, even when the two tests are performed a month apart from each other. Our study also supports the notion that, provided that the same equipment and procedures are used, the test–retest reliability of the measures is mostly comparable between the subsets of participants investigated.
The reliability of measures must always be evaluated in light of their intended application [30]. In studies examining the effects of aging or training interventions on muscle function, this necessitates ensuring that the anticipated changes associated with aging or the expected effects of the intervention significantly outweigh the fluctuations indicated by reliability statistics. In this regard, the typical errors reported in this paper indicate that the reliability of muscle function measures obtained from both the single and multi-joint exercises tested may be adequate for use in exercise intervention studies. As an example, peak power output improved by 24%−34% on average at loads between 30–90% 1‑RM in the LP after a 12-week high-velocity resistance training program in the present sample [22]. These improvements far outweigh the typical error values reported in the current manuscript, even at the 90% 1‑RM load.
The present results also serve to expand on the findings of our main trial publication [22] by providing a background against which the individual results of the training intervention can be further scrutinized to confirm its efficacy. As previously emphasized by Perera et al. [31], it is crucial to consider whether estimates of measurement error or meaningful change, such as the SEM and the MDC, can be realistically achieved due to the investigated phenomenon (e.g., aging) or the manipulation of independent variables (e.g., exercise training). To further exemplify this, we included a figure (Fig. 1) displaying both the absolute and relative change in LP 1‑RM performance for each of the participants included in the aforementioned trial, as well as indicated the SEM, the MDC, and the CV values reported in Table 2 of the current manuscript.
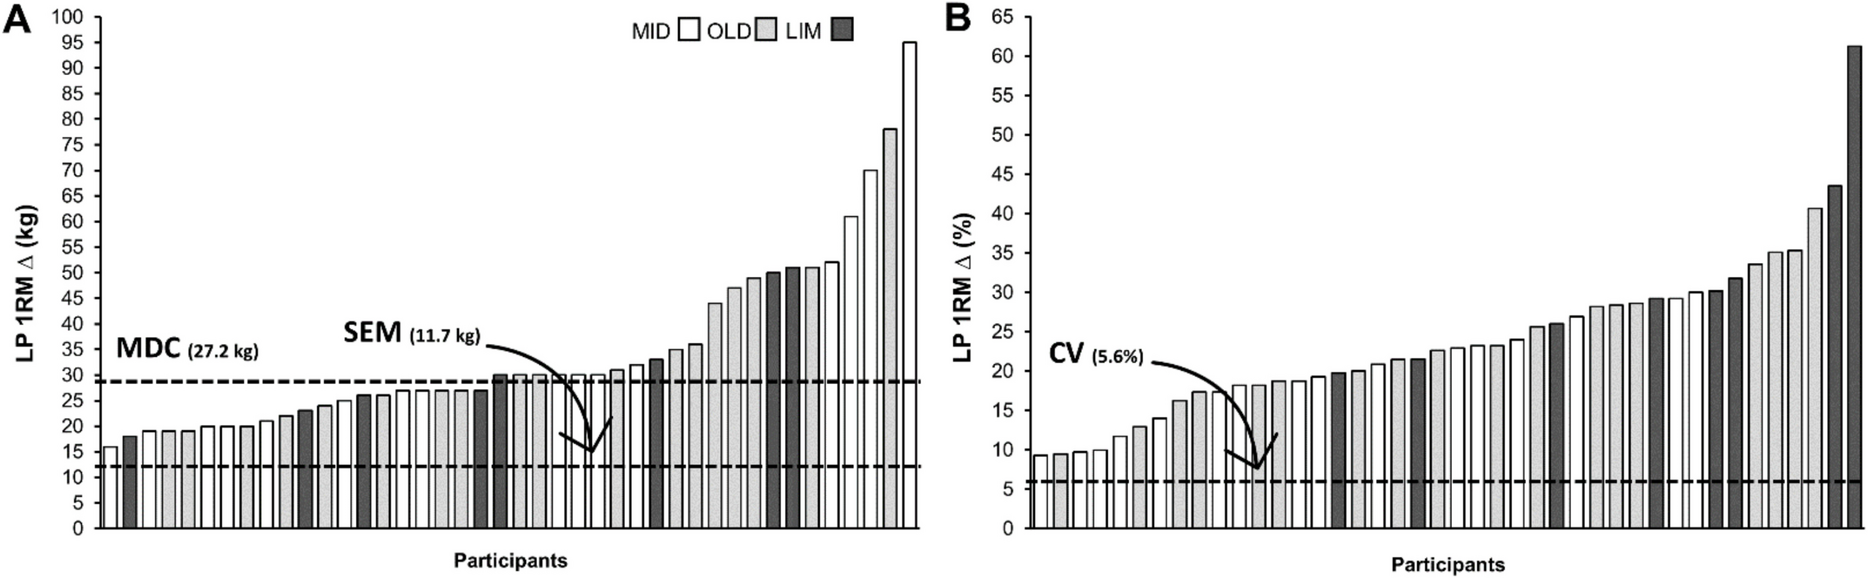
Fig. 1
Leg press 1‑RM results (pre-post-training difference, ∆) from an exemplary 12-week high-velocity resistance training intervention (Schaun et al., 2022). The horizontal lines correspond to the standard error of measurement (SEM), minimal detectable change with 90% confidence (MDC), and the coefficient of variation (CV) as determined in the present study. LP = leg press; 1‑RM = one repetition maximum; MID = middle-aged adults; OLD = older adults; LIM = mobility-limited older adults
When comparing the SEM results with the improvements of each participant in response to the 12-week high-velocity resistance training program, it becomes evident that every individual increased their LP 1‑RM performance by more than the SEM (11.7 kg). As a result, this finding gives us confidence that the differences observed on this measure were not attributable to measurement error, but rather reflect a systematic change in participants’ performance. Further comparison with the MDC (27.2 kg) provides an even more appropriate context for evaluating the efficacy of the intervention, given the sample variability. Specifically, our analysis suggests that approximately 52% of the entire sample experienced real changes in performance (i.e., not likely due to chance variation; [32]), with improvements observed for 22 out of 42 participants.
The previous example also enables us to compare the reliability results calculated for the entire sample (see Table 2) with those observed for each of the three groups (refer to Supplementary Table 1), and to assess its impact on the conclusions drawn from the intervention. As mentioned above, comparing the changes in LP 1‑RM performance against the MDC calculated for the entire sample suggests that approximately 50% of the sample experienced a real change in their maximal strength on the LP. A closer examination at Fig. 1 reveals that 8 of the 17 participants in the middle-aged group, 10 of the 18 participants in the healthy older adults’ group, and 4 of the 8 participants with mobility limitation exhibited a change in performance greater than the MDC. This frequency distribution, with roughly 50% of participants in each of the three groups, supports the notion that the capacity of older individuals to respond to training is maintained and comparable to that of younger participants, at least up to individuals with mild to moderate limitations in mobility.
Alternatively, applying the MDC values calculated for each individual group (39.2 kg, 11.8 kg, and 20.1 kg for the middle-aged, healthy older, and mobility-limited older adult participants, respectively) to the changes in performance observed for those specific participants presents a different perspective. This analysis suggests that approximately 71% of participants experienced a real change in their LP 1‑RM performance (data not shown), but with a notable shift in the frequency distribution within each group. While only 4 of the 17 middle-aged participants would be considered as having genuinely improved their 1‑RM value, all 26 participants in the two other groups would be considered to have experienced a real change in their maximal strength. As a consequence, these results would support a different conclusion than the one suggested above. Rather than highlighting the comparability of the older participants to those younger or possessing a better functional capacity, these findings would suggest that the training dose might not have been optimal for improving performance in the middle-aged participants or that a longer training period would be necessary for this specific population based on the training dose provided. Although caution is necessary in interpreting these results due to the relatively small sample sizes of the three individual groups, this real-life example underscores the importance of acquiring appropriate reliability estimates for the population one is interested in studying and their potential impact on conclusions driven from it.
This is also relevant in studies involving heterogeneous samples, where variations in functional capacity, health status, or mobility differences may be present. Significant variability in reliability between subsets of participants could introduce bias, confounding factors, or measurement errors, undermining the validity of pooled data and conclusions about intervention effects. In randomized clinical trials, reliable baseline and follow-up measurements are critical for detecting true intervention effects and distinguishing them from variability due to measurement error. Demonstrating consistent reliability across diverse subsets, such as middle-aged adults and older adults with mobility limitations, ensures these tests can be confidently applied, regardless of participant characteristics, thereby enhancing the confidence in and generalizability of findings. Conversely, substantial differences in reliability between these subsets could complicate comparisons both within and between study arms, particularly if subset representation is uneven or improperly accounted for in data analysis.
When considering the individual measures investigated, in the present study we demonstrate maximal strength measures derived from both dynamic and isometric tests to possess excellent reliability, both in the entire sample and when determined separately for each group. This is in line with previous research that showed similar results in middle-aged and older adults [33,34,35], including in those with mobility limitations [18, 19]. The fact that reliable results were obtained in both isometric and dynamic strength tests, as well as in single- and multi-joint exercises, suggests that researchers can select the appropriate maximal strength measure based on the specific muscle actions they are most interested in [35].
Maximal strength measures are often coupled with sEMG in an attempt to obtain additional information regarding the underlying organization and production of movement [36, 37]. In our investigation, sEMG measures showed good relative reliability, whereas absolute reliability was found to be less reproducible as compared to the other measures investigated. As suggested by Dutra et al. [38], the poorer agreement observed in the sEMG measures can be partly explained by the random nature of motor unit action potentials, which leads to greater variability in the sEMG signal as compared to that observed in measures such as muscle force. Consequently, the high intra-individual variability of the sEMG signals may limit the applicability of sEMG measures to assessing group mean responses to an intervention, at least in these particular muscles and with the procedures employed in the current study [39].
Muscle size and quality measures, on the other hand, exhibited excellent absolute test–retest reliability, whether assessed individually for each muscle or combined to represent the quadriceps femoris muscle. More importantly, the reliability outcomes remained comparable across the three groups, with consistently lower CV values observed for the RF and VL muscles, as well as for the aggregated quadriceps data. The results for the RF and VL muscles also fall within the range of those previously reported in older adults [40,41,42,43,44], even when compared to more valid measures of muscle size such as panoramic ultrasound-derived muscle cross-sectional area [42, 45]. Taken together, our findings reinforce the utility of ultrasound-derived MT and EI measures for comparative analyses of age- and health-related differences in muscle size and quality, as well as their responsiveness to interventions like physical exercise, even among individuals exhibiting significant reductions in muscle function.
As for the power measures, although CV values seemed slightly larger in the LP as compared to KE, results were mostly comparable between the two exercises. Moreover, when considering the different loads, results in the range of 30% to 70% 1‑RM typically showed good to excellent reliability and an acceptable CV. Peak power measures at higher loads, on the other hand, exhibited larger CV values, especially at 90% 1‑RM.
Possible explanations for these results could be related to the protocol used by us to assess peak power. Specifically, in the current study peak power was measured at each load using only a single repetition, whereas previous research in older adults with and without mobility limitations suggested that using two to three repetitions per load could be preferable for achieving more reliable results [19, 46]. In addition, the order of the loads during the power tests could not be randomized and, although unlikely [47], performance with the final loads might have been influenced by cumulative fatigue. Therefore, although the relative reliability results reported by us are within those reported for muscle power testing [47], our absolute reliability results could serve as a more conservative estimate of the reliability estimates.
Finally, functional measures also showed good to excellent reliability results. More importantly, the absolute reliability values were typically close to or below the clinically meaningful differences proposed for some of the tests investigated (e.g., [31, 48,49,50]). In addition, comparison between the groups suggests that differences in test–retest reliability do not follow a clear trend between the groups and should be considered separately for each test. As an example, while 30-s sit-to-stand performance showed lower CV in the group with mobility limitation, the 6-min walk test showed higher CV values in the same group, whereas results from the timed up-and-go test were similar between the three groups. It should be noted, however, that despite these differences in magnitude CV values were relatively low for all the groups.
Considerations for future studiesDifferences in test reliability can have significant implications for study design, particularly when comparing diverse groups or subsets of individuals. While the results of the current study indicate that reliability was relatively similar across groups for most measures investigated, it remains important to consider potential challenges and implications associated with reliability differences in future research.
Substantial variability in reliability between groups may complicate the interpretation of results. Low reliability within one group reduces the robustness of typically used parametric tests due to inhomogeneity of variance, which reduces statistical power. Similarly, high variance and uncertainty of true scores impact the interpretability of effect sizes. In the present study, reliability metrics, including SEM, MDC, and CV, were largely consistent across middle-aged participants, healthy older adults, and older adults with mobility limitations. However, subtle differences were observed for some measures, such as the 30-s sit-to-stand and 6-min walk tests.
To address these differences, future studies should prioritize improving measurement precision by means of enhancing the signal-to-noise ratio. Strategies to achieve this would include refining testing protocols, providing additional familiarization sessions, offering clearer explanations and cueing, repeating the test and averaging the scores to reduce noise, whenever possible, and using higher-resolution measurement tools. These steps can reduce variability and improve the reliability of test outcomes, thereby enabling more accurate comparisons across groups. A secondary approach, though less ideal, involves increasing sample sizes in groups with lower reliability. While this can mitigate some effects of variability in group-level comparisons, it is important to note that it does not resolve the underlying issue of individual-level measurement error.
Furthermore, researchers must recognize the limits of improving precision alone. Beyond a certain point, efforts to enhance measurement sensitivity may yield diminishing returns, particularly if the changes detected are not meaningful or clinically relevant. For example, detecting minuscule differences, such as nanoseconds in a TUG test, does not increase the signal-to-noise ratio and may not translate into practical or actionable insights. As such, intervention designs may also need to be planned in a way that increases the likelihood that the improvements observed will exceed the estimates of measurement error, such as planning interventions with a slightly longer duration or optimizing the intervention itself by carefully considering its components (e.g., intensity and volume, as in the case of exercise trials).
LimitationsThe present study is not without limitations. First, the small sample size for the group-specific analyses can potentially limit the external validity of our results and the precision of the estimates, especially for the participants with mobility limitations. Caution is also needed when extrapolating these results to severely limited individuals, as our sample included only individuals with mild to moderate limitations in mobility. Another possible limitation is the fact that sEMG amplitude data were not corrected to account for the influence of subcutaneous adipose tissue, even though no difference was previously found between original and corrected sEMG values when comparing middle-aged and older adults with and without mobility limitation (Clark et al., 2010). Finally, although the sex distribution was similar (~ 50%) in each of the subgroups included, the impact of sex on the reliability measures reported was not possible to be determined and should be taken into consideration.
Despite these limitations, the results of the present study offer valuable insights that can aid researchers in planning future trials. Specifically, the reported SEM, MDC, and CV values can guide researchers in estimating appropriate sample sizes for their studies, including the design of pilot investigations. Practitioners can also benefit from these findings by using them as a reference point to evaluate changes resulting from training or rehabilitation programs tailored to middle-aged and older individuals with functional profiles similar to those in this study. This approach can serve as a practical starting point until practitioners establish their own reliability measures, as is commonly recommended.
Comments (0)