Database
The UK Biobank is a large, prospective cohort study established between 2006 and 2010, enrolling slightly over 500,000 participants aged 37–73 residing in the UK (details are presented elsewhere (30)). Participants completed self-administered questionnaires and in-person interviews across 22 geographically distributed assessment centers in England, Scotland, and Wales (30). The study collected biological samples and extensive phenotypic data (30). Ethical approval for the UK Biobank was granted by the Northwest Multi-Centre Research Ethics Committee. The current project (77963) has received the necessary approvals from both the UK Biobank and the National Institutes of Health Institutional Review Board.
Mortality linkage
Death registry was used for linkage of the entire UK Biobank cohort as outlined elsewhere: https://biobank.ndph.ox.ac.uk/ukb/ukb/docs/DeathLinkage.pdf. The present study utilized only the date of death provided by the UK Biobank dataset, even though the latter also provided primary as well as contributory causes of death, through the ICD-10 coding system.
Dementia outcome
The study used algorithmically generated data from hospital registry linkages, specifically fields 42018 and 42020, to analyze dementia cases. Further details on this methodology are available at (https://biobank.ndph.ox.ac.uk/ukb/ukb/docs/alg_outcome_main.pdf). Participants whose dementia onset age preceded their baseline assessment age were excluded from the analysis (https://biobank.ndph.ox.ac.uk/ukb/ukb/docs/alg_outcome_main.pdf). We identified incident Alzheimer’s disease (AD) cases using ICD-10 codes F00 and G30, while other dementia types, including vascular dementia (F01, I67.3), were classified using additional codes (A81.0, F00, F01, F02, F03, F05, G30, G31.0, G31.1, G31.83, I67.3). The method described previously was employed to determine the date of the first occurrence of any type of dementia among many outcomes of interest (https://biobank.ndph.ox.ac.uk/ukb/ukb/docs/alg_outcome_main.pdf).
PD
PD was identified using an algorithm similar to that which we used for dementia, with the ICD-10 code G20 used to denote PD. This identification method combined hospital records, death records, and self-reports. A validation study of 20,000 UK Biobank participants demonstrated a positive predictive value of 91% for this approach (https://biobank.ndph.ox.ac.uk/ukb/ukb/docs/alg_outcome_main.pdf).
Polypharmacy
The main exposure of interest, namely POLYPH, was defined using UKB field 137. This variable was then categorized as POLYPH− or 0–1 medications used and POLYPH2+ or 2+ medications used. In part of the analysis with multistate modeling, POLYPH was coded as 0–4 medication used (POLYPH−) vs. 5+ medications used (POLYPH5+) to assess the effect of moving the threshold to a higher level as suggested in a recent systematic review (26), and more details on the concept are provided by a technical World Health Organization report (https://www.who.int/docs/default-source/patient-safety/who-uhc-sds-2019-11-eng.pdf). In fact, the recent systematic review describes all cutoffs used and states that 5+ is the most common one, which we used in conjunction with 2+ cutoff (26).
Commonly used medications
To further investigate which medication groups contributed to the association between exposure and outcome, we identified medications used by at least 5000 participants (48 out of 6745 total medications listed) from the UK Biobank cohort (total N = 500,000), as recorded in UKB field 20003 at instance 0 (baseline assessment), covering an array of 48 possible specific medications. These data were used to conduct a latent class analysis (LCA) and generate probabilities of membership in each of these latent classes, as well as a predicted class membership, as detailed in Supplementary methods 2.
Covariates
We adjusted for the following potential demographic confounders including sex, baseline age, race/ethnicity (White, Black, South Asian, and Others), and household size. Socioeconomic characteristics were also accounted for, given their putative associations with both the outcomes of interest and the main exposure. Those included educational attainment, household income, and occupation. Educational attainment was re-coded as low (“CSEs/Equivalent,” “NVQ/HND/HNC/Equivalent,” or “Other professional qual”), intermediate (“O Levels/GCSEs/Equivalent” or “A/AS Levels Equivalent”), or higher level (“College/University”). Total household income before tax was divided into five categories (“£18,000,” “£18,000–£29,999,” “£30,000–51,999,” “£52,000–£100,000,” “>£100,000”). Occupation (UKB field 20277) was assessed at baseline assessment using the SOC2000 coding system, a hierarchical structure that assigns categories with integers. We grouped these occupations into broader categories in descending order of SES ranging from 1 “managers and senior officials” to 9 “elementary occupations” (categories detailed in Table 1).
Table 1 Study sample characteristics by sex: UK Biobank 2006–2021The Townsend Deprivation Index (TDI) was estimated using national census statistics, accounting for car ownership, home overcrowding, owner occupation, and unemployment. Higher TDI scores indicate greater socioeconomic deprivation. The index was computed immediately before participants joined the UK Biobank and is based on the preceding national census output areas, assigning each participant a score corresponding to the output area of their postcode.
We standardized all SES factors and calculated them such that higher scores reflected higher SES. An overall SES z-score was calculated using proration, requiring at least two of the four measures to calculate an average z-score. An alternative SES z-score (SESres), independent of TDI, was derived by regressing the overall SES z-score on TDI, with residuals representing education, income, and occupation variability.
We also included markers of cardiovascular health (CVH) using the American Heart Association’s “Life’s Essential 8” (LE8). The LE8 score, which ranges from 0 to 800, includes sleep health in addition to the original seven factors from Life’s Simple 7 (LS7): diet quality, increased physical activity, reduced cigarette smoking, lower BMI, total cholesterol, fasting blood glucose levels, and optimal blood pressure. The LE8 score was standardized and reverse-coded, with higher scores reflecting poorer CVH. Finally, we accounted for the number of comorbid conditions and self-rated health. We used two data fields (134 and 135) to create indices for cancer and non-cancer comorbidities at the baseline assessment. Self-rated health (excellent, good, fair, poor) was also assessed at baseline, with higher scorings indicating poorer health.
Study sample selection
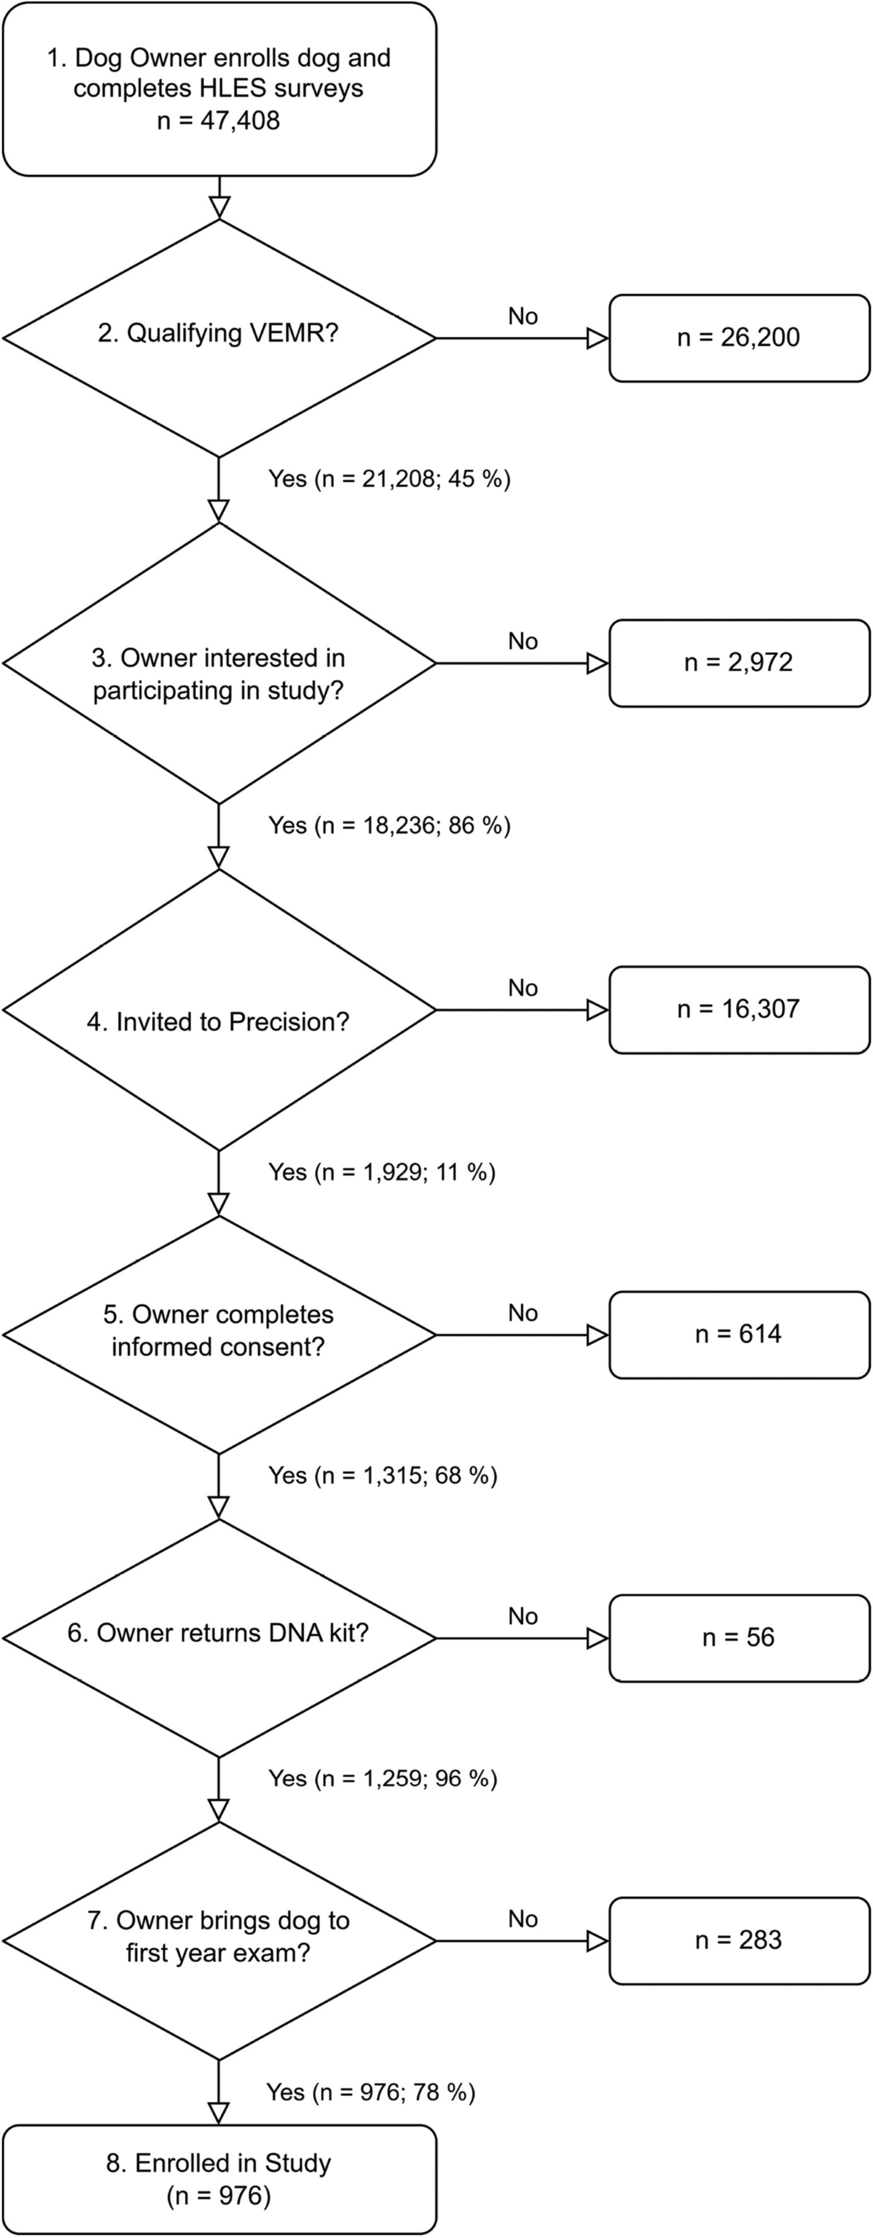
The initial UK Biobank sample, excluding those withdrawing consent, consisted of 502,160 individuals, with 384,486 of them being 50 years old or older at the initial recruitment. The dataset included information on 362,937 individuals’ socio-demographic, socioeconomic status (SES), lifestyle, and biological traits, which were necessary for analyzing all the key outcomes, exposures, and variables. After excluding 967 cases of pre-existing PD or dementia, the final sample size comprised 361,970 people who were free of dementia and PD. The participants were followed for up to 15 years for all three outcomes of interest (Figure S1).
Statistical methods
The analyses were conducted using Stata 18.0 software (31). We first computed descriptive statistics, using means and proportions to characterize our sample overall and by sex. We then used time-to-event analysis to examine the associations between exposure and outcome, with time on study used as the underlying time metric. The study exit time was defined as either the age at which an incident or absorbing event occurred (such as all-cause dementia, PD, or all-cause mortality) or the age at which censoring occurred (either death or the end of follow-up, which was set to October 31, 2021, in the case of dementia and PD). In order to assess variations in the likelihood of event-free survival, we calculated Kaplan-Meier survival rates at different follow-up ages. We then compared these rates using a log-rank test across the two exposure groups (“2+”=1 vs. “0–1”=0 for medications used, or the POLYPH2+ exposure). Afterwards, Cox proportional hazards (PH) models were used to examine the association between POLYPH2+ and each incident event of interest, namely PD, all-cause dementia, and all-cause mortality. These models were adjusted for age at baseline, sex, racial minority status (non-White vs. White), number of individuals living in the same household, the TDI z-score reflecting area-level socio-economic deprivation, SESres z-score reflecting individual-level socio-economic status, and LE8zrev reflecting poorer CVH with a higher score, the number of co-morbidities, and self-rated health. We assessed the validity of the primary Cox proportional hazards models by examining Schoenfeld residuals and employing additional techniques to identify any potential violations of the assumption of proportional hazards. For this portion of the analysis, we stratified our sample by sex and examined the differences between males and females by including a two-way interaction between sex and POLPH+ exposure in the fully adjusted Cox proportional hazards model. A sensitivity analysis was performed using the Royston-Parmar flexible parametric model, incorporating limited cubic splines to represent baseline age. The model had 3 degrees of freedom and an interaction term with baseline age (32).
We extended our analysis by modeling transitions between health states and mortality using multistate models, which provided deeper insights into the relationships between variables and health transitions (33). While semiparametric strategies, such as the Cox model, are widely used, the benefits of a fully parametric approach are not as well acknowledged (33). Parametric approaches offer several advantages, including the ability to predict, extrapolate, and quantify data. These benefits are especially valuable when used in conjunction with customized treatment and substantial registry-based data sources (33). In our current investigation, we employed a systematic method to evaluate the suitability of the Weibull model compared to other parametric options. After demonstrating that the Weibull regression model produced similar outcomes to the most suitable model, our final objective was to extrapolate the variations in survival between different exposure groups from this model. This portion of the analysis consisted of procedures that are detailed in Supplementary methods 1.
To summarize these steps, we analyzed the association between exposure to certain medications and health outcomes in individuals with PD or dementia. The dataset was arranged using Stata’s msset command, incorporating three events of interest and their corresponding age at occurrence. The data was organized into four states: “healthy,” “PD,” “dementia,” and “deaths.” A transition transformation matrix was created using the msboxes command, and the Aalen-Johansen estimates of transition probabilities were calculated. Parametric survival models were estimated using POLYPH as the primary variable of interest, considering factors such as age at baseline, sex, race, household size, TDI z-score, SESres, LE8z_rev, the co-morbidity index, and self-rated health. POLYPH2+ and POLYPH5+ were defined as both 2+ and 5+ medications, respectively, in this part of the analysis. Survival probabilities were estimated for each transition and associated model, using Kernel-weighted local polynomial smoothing throughout the age of follow-up, assessing differences in survival probability between exposed and unexposed groups. A sensitivity analysis was performed to compare the fully adjusted parametric model with different distributional specifications. The UK Biobank field 20003 was used to examine which groups of medications explained any association between exposure and outcome. Latent class analysis (LCA) was conducted to generate probabilities of membership in each latent class, as well as a predicted discrete class membership variable. We used improvements in the Akaike Information Criterion (AIC) and the Bayesian Information Criterion (BIC) to select class sizes. A mediation analysis was conducted using generalized structural equations (GSEM) models to explain detected associations between each latent class and the outcome of interest through POLYPH2+ or POLYPH5+(2+ and 5+ thresholds). The direct effect of each latent class of medications was of primary interest in these models. Latent classes were labeled and visualized as heat maps, based on a series of bivariate logistic regression models producing Loge(odds ratio) of each latent class as modeled against each of the common medications from which the latent classes were estimated.


Comments (0)