
Remember me


As most public real datasets lack comprehensive and precise annotations, it is challenging to thoroughly evaluate and compare different methods for dissecting spatial components. Therefore, we conducted four sets of simulations to simulate spatial expression in various situations (Methods).
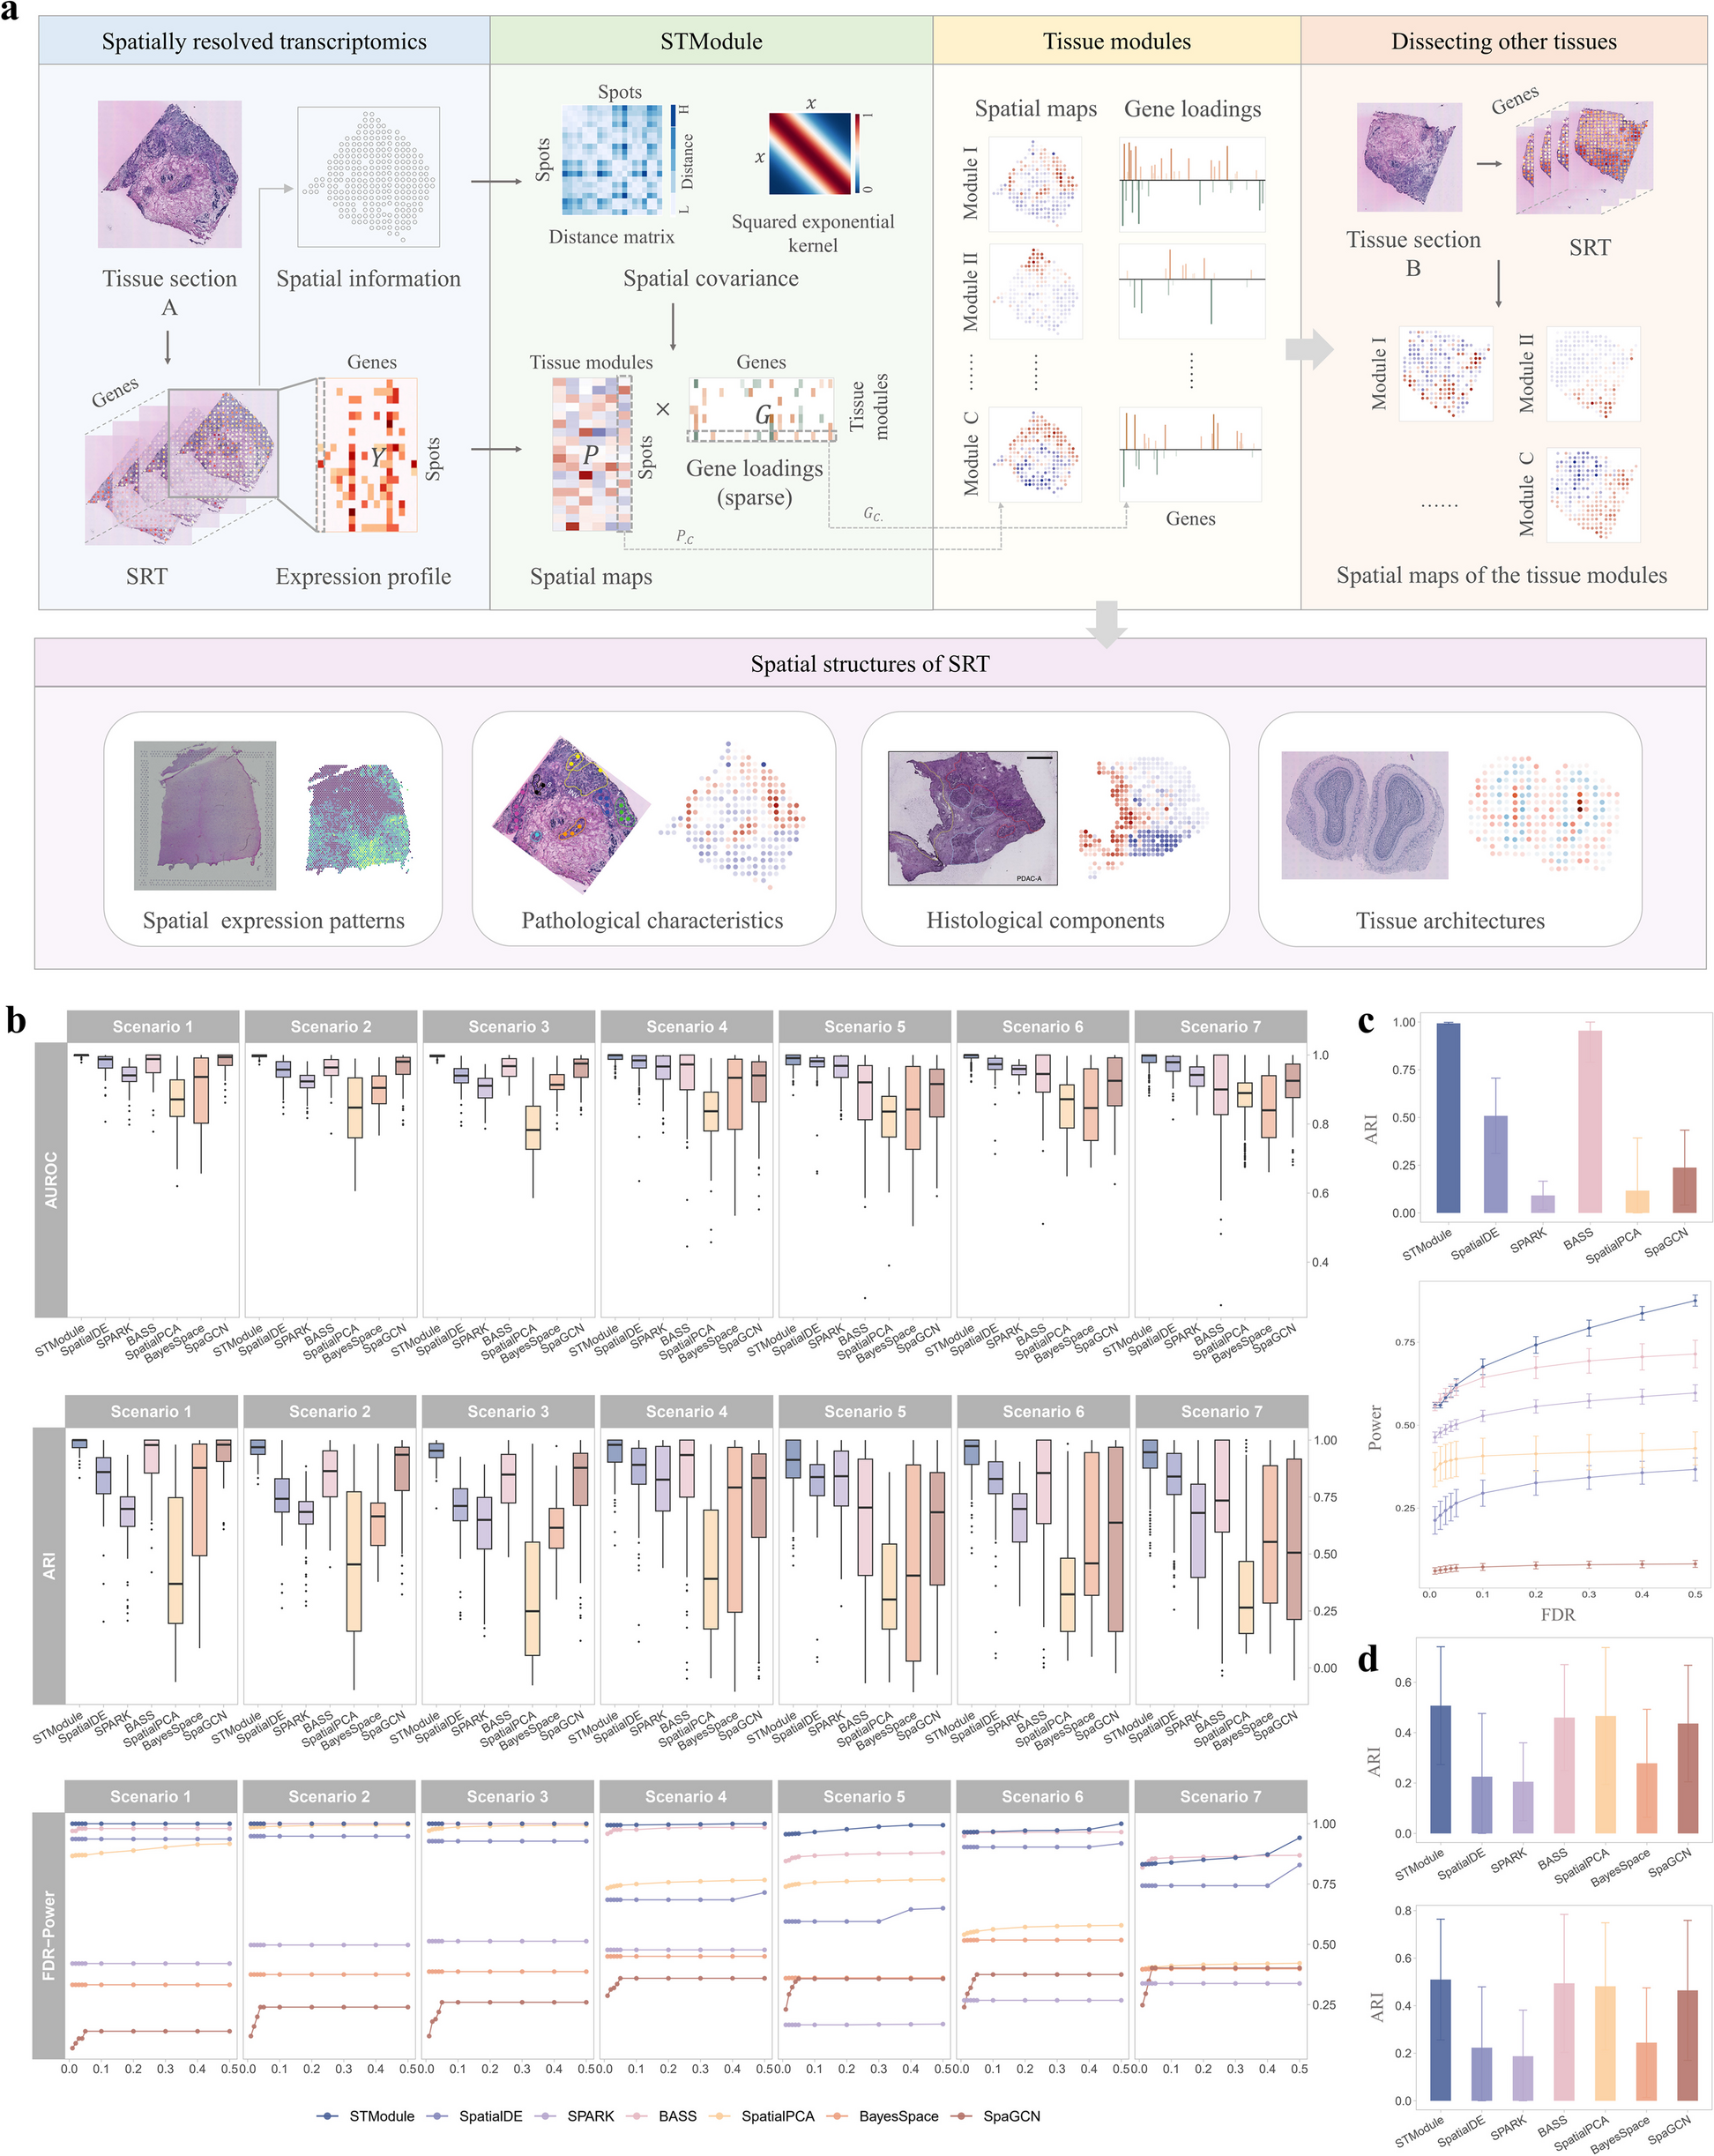
In the first set of simulations for spatially expressed patterns, STModule outperforms other methods in spatial pattern identification and is superior or comparable to BASS in detecting associated genes (Fig. 1b and Additional file 2: Fig. S2a, b). Specifically, in scenarios 1–3, most methods exhibit a decline in both AUROC and ARI as the patterns become more complex, while STModule remains relatively stable. In scenarios 4 and 5, the methods demonstrate better performance in scenario 4 for both spatial pattern and associated genes, suggesting that disentangling related or convoluted biological signals is more challenging than identifying independent ones. In scenarios 6 and 7, the methods also perform better in the simpler case of scenario 6, which features two multi-scale patterns, compared to scenario 7 with three patterns, particularly regarding associated gene detection. Examples of simulated spatial patterns in different scenarios and corresponding patterns/clusters identified by different methods are illustrated in Additional file 2: Fig. S3. In the second set of simulations focused on DLPFC layer-wise patterns, STModule and BASS far surpass the other methods in distinguishing the layers and their associated genes (Fig. 1c and Additional file 2: Fig. S2c). In addition, most methods struggle to perform well in both tasks across the two simulation sets, demonstrating a trade-off between them. For instance, SpatialPCA achieves better performance in detecting associated genes compared to BayesSpace and SpaGCN but is less effective in pattern identification.
In the third and fourth sets of simulations, we evaluated the methods on DLPFC and mouse brain profiles simulated based on real data for pattern identification and SVG detection, respectively. STModule also better discriminates the layers of DLPFC compared to the others and ranks just behind SpatialDE in SVG detection even though it is not tailored for this task (Fig. 1d and Additional file 2: Fig. S2d, e). As in the first set of simulations, it is more difficult to differentiate layers in whole-tissue profiles with more intricate structures (STModule, avg. ARI 0.49) than layer-wise profiles (STModule, avg. ARI 0.99). The superior performance of STModule across the sets of simulations in both spatial pattern and associated gene detection highlights the benefits of integrating these tasks to better unravel the intricate structures and characteristics of tissues, where the spatial patterns guide the algorithm in retrieving the corresponding genes while the detected genes, in turn, help refine the patterns iteratively.
STModule reveals pathological and histological characteristics of PDACTo investigate the efficacy of STModule in dissecting tissue modules in real SRT datasets, we first applied it to a human PDAC sample (PDAC-A) profiled by ST [4] (Fig. 2). The tissue modules were interpreted according to the annotations in the original study, signatures identified in previous studies [36, 73, 74] and examination of the H&E-stained image by experienced pathologists (Fig. 2a, b and Additional file 2: Fig. S4). The spatial map of module I aligns well with the cancer regions, as well as the spatial expression of module-associated genes such as KRT17, TM4SF1, and S100A4, which have been reported as PDAC markers [36, 73, 74] (Additional file 2: Fig. S5). Module II represents duct epithelium, expressing high levels of ductal cell markers including MUC5B, DMBT1, and CRP [33, 36]. Module III is enriched with genes of cancer-associated fibroblasts (CAFs) like COL1A1, COL1A2, and COL3A1, distributing spatially around cancer cells for tumorigenesis promotion [75]. Module X is annotated as stroma based on the H&E-stained image (Additional file 2: Fig. S6a).
Fig. 2
Results of the human pancreatic ductal adenocarcinoma dataset. a Spatial maps of tissue modules identified by STModule and spatial expression of representative associated genes. Colors indicate module activities or gene expression levels at different spots. b Histological annotation of sample A in the original study [4]. Red, cancer cells and desmoplasia. Yellow, duct epithelium. Blue, normal pancreatic tissue. c Representative spatial patterns identified by SpatialDE and SPARK. d Results of domain clustering methods. Colors indicate different clusters. e Additional spatial patterns identified by STModule with 15 modules. f Histological annotation of sample B in the original study [4] (left) and two tissue modules identified by STModule. Red, cancer cells and desmoplasia. Yellow, duct epithelium. Green, interstitium. g Spatial distributions of major cell types of sample A estimated by CARD. h Comparison of the methods in terms of correlation and ARI of identifying domains. i GSEA of associated genes detected by the methods. White color indicates adjusted P-value \(\ge\) 0.05
Furthermore, STModule detects tissue modules indicative of cell subtypes with particular biological signals, including antigen-presenting CAFs (apCAFs) (module IV) expressing both CAF markers and major histocompatibility complex class II (MHC II) genes such as CD74 [76], and subtypes of endocrine, including alpha cells (VIII) and beta cells (IX) located in line with islets in the H&E-stained image (Additional file 2: Fig. S6a). Module V represents acinar cells distinguished by high expression of CTRB1, CTRB2, and PRSS2 [36], while module VI identifies a subset (acinar REG −) with low expression of REG gene family, e.g., REG1A and REG3G, leaving the others as acinar REG + that promote acinar-to-ductal metaplasia (ADM) and pancreatic intraepithelial neoplasia (PanIN) in PDAC [36] (Additional file 2: Fig. S4 and Fig. S5). STModule also highlights another spatial pattern (VII) presented by a set of MT-RNR2-like genes, including MTRNR2L12, MTRNR2L1, and MTRNR2L8, which encode a mitochondrial-derived peptide humanin that suppresses cell apoptosis, acts as a cytoprotective factor, and improves function of pancreatic beta cells [77, 78]. Specifically, as an intracellular signal, humanin exerts its cytoprotective effects by interacting with proteins of the Bcl-2 family to inhibit the intrinsic or mitochondrial apoptotic pathway [79]. It has also been reported to act as a therapeutic target of cancers and degenerative diseases [79, 80]. Functional analysis of the tissue modules in terms of GO terms, KEGG pathways, and Reactome pathways shows agreement with the above annotations (Additional file 2: Fig. S7 and Fig. S8).
We applied SpatialDE, SPARK, BASS, SpatialPCA, BayesSpace, and SpaGCN to the same tissue for comparison (Fig. 2c, d, and Additional file 2: Fig. S9), as well as CARD for cell type deconvolution (Additional file 2: Fig. S6b). SpatialDE and SPARK detect spatial patterns of cancer cells, duct epithelium, acinar cells, and CAFs, while spatial domain clustering methods outline the basic structure organization of the tissue. It is challenging for the clustering methods to distinguish between the convoluted signals caused by the low resolution of ST data, for instance, the co-occurrence and overlapping distributions of cancer cells and CAFs. BayesSpace performs better as it offers enhanced clustering with improved resolution. The spatial distributions of tissue modules identified by STModule, which represent cell types such as acinar cells, fibroblasts, ductal cells, and endocrines, are concordant with the results of CARD, indicating that although not educated with prior knowledge, STModule is able to uncover them through spatial expression patterns.
We further explored the outcomes of STModule by factorizing the tissue into 5 and 15 modules respectively and compared them to the 10-module results. With 5 modules, STModule detects major components of the tissue including cancer cells, duct epithelium, CAFs, acinar cells, and spatial expression of MT-RNR2-like genes (Additional file 2: Fig. S10), which comprise a subset of the 10-module results. Expanding to 15 modules, STModule identifies additional spatial structures representing subtypes of ductal cells including centroacinar (III; AQP3), terminal (IV; TFF1, TFF2, TFF3), and antigen-presenting (V; CD74) [4], pancreatic glands (XIV), and macrophages (XV) (Fig. 2e and Additional file 2: Figs. S11-S14). Overlapping modules aligned to the same structures in the three settings show significantly high consensus of associated genes (Additional file 2: Fig. S15). Modules linked to the same cell type also demonstrate higher similarity due to shared basic functions and biological pathways, e.g., CAFs vs. apCAFs, acinar cells vs. acinar cells (REG −), and subtypes of ductal cells.
In addition, applied to another sample (PDAC-B) in this dataset, STModule detects cancer cells, fibroblasts and acinar cells, and subtypes of ductal cells, as well as atypical ductal cells which suggest a progression from ductal cells to malignancy [73] (Fig. 2f and Additional file 2: Figs. S16-S20). Results of comparison methods are illustrated in Additional file 2: Fig. S21a, b. Based on the spatial distributions of cell types related to the histology features of the two samples estimated by CARD (Fig. 2g and Additional file 2: Fig. S21c), we evaluated the methods in identifying these features as well as associated genes (Methods). STModule demonstrates the highest correlation, ARI, AUROC, and AUPR in identifying the domains and the detected associated genes of the domains are enriched with corresponding cell type markers (Fig. 2h, i and Additional file 2: Fig. S21d). Particularly, higher correlations between the tissue modules and domain-related cell types indicate that STModule not only identifies the spatial locations of the domains, but also better preserves their strength across the landscape. The results suggest that STModule effectively identifies tissue modules from SRT data, capturing histological structures and pathological signals of tissues.
STModule detects modules applicable across different sections of breast cancerWe applied STModule to a breast cancer dataset profiled by ST [13]. The original biopsy was sliced at 16 \(um\) thickness, and every fourth slice was selected for SRT profiling, resulting in four quantified sections labelled as layers 1–4. Applied to layer 2, STModule identifies 10 modules annotated as ductal carcinoma in situ (DCIS) (I), invasive ductal cancer (INV) (II), CAFs (III and IV), immune-related signals (V, VI and VII), perivascular cells (VIII), endothelial cells (IX), and normal breast glands (X), respectively (Fig. 3a–c and Additional file 2: Figs. S22-S25).
Fig. 3
Results of the human breast cancer dataset. a Spatial maps of tissue modules identified by STModule and spatial expression of representative associated genes. Colors indicate module activities or gene expression levels at different spots. b Histological annotation of the tissue section in the original study [13], containing invasive ductal cancer (INV) and six areas of ductal cancer in situ (DCIS) (1 to 6). c Illustration of most enriched Gene Oncology terms of representative modules. Color indicates the value of − log10(P-value). Dashed grey lines represent the threshold of P-value = 0.05. d Representative spatial patterns identified by SpatialDE and SPARK. e Results of domain clustering methods. Colors indicate different clusters. f Spatial distributions of cancer and CAFs estimated by CARD. g Comparison of the methods in terms of correlation and ARI of identifying domains in f. h GSEA of associated genes detected by the methods. White color indicates adjusted P-value \(\ge\) 0.05. i Application of the tissue modules to the other three sections collected from the same biopsy. Spatial maps of modules I, IV, and VI in a are illustrated with manual alignment to the corresponding H&E-stained images
Specifically, module I is highly activated in the six DCIS areas identified in the original study, representing the spatial expression of breast cancer markers such as SPINT2, FXYD3, and ERBB2 [35]. Module II (INV) is associated with high expression of FN1, a marker gene of epithelial-mesenchymal transition (EMT) [22], which is closely related to tumorigenesis, invasion and metastasis, and predicts poor outcome of breast cancer[81,82,83]. Overexpression of another member gene SERPINA3 is also reported to promote tumor invasion and EMT in breast cancer[84]. Module III represents CAFs expressing COL1A1, COL1A2, and COL3A1 [35] enriched in the cancer regions, whereas module IV identifies a subset known as myofibroblasts (myCAFs) (COL12A1, THBS2) that mainly contribute to extracellular matrix remodeling and growth and metastasis of cancer cells [85, 86]. Distinct signals of the immune landscape are detected, including B cells (V; IGLL5, JCHAIN), myeloid cells (VI; CD74, CST3, APOC1), and spatial expression of B2M (VII), an essential component of MHC class I antigen presentation [87]. The loss of B2M has been linked to immune escape and resistance of immune checkpoint blockade therapies, making it a potential biomarker of immunotherapy[88,89,90]. Compared to the results of other methods (Fig. 3d, e and Additional file 2: Fig. S26a, b), STModule better detects the cancer and CAF domains as well as associated genes (Fig. 3f–h and Additional file 2: Fig. 26c), especially the cancer region with ARI 0.57 compared to ARI \(\le\) 0.46 of other methods, producing more accurate spatial maps of histological and pathological characteristics of the tissue.
As the tissue modules reveal recurrent communities that exert specific biological functions, they are expected to generalize to other regions of the same tissue. Therefore, we further investigated whether these modules could decode the spatial components of corresponding biological signals in other sections of the biopsy. We inferred spatial maps of the modules for layers 1, 3, and 4, respectively (Methods). The spatial maps align well with respective histological and pathological structures as well as spatial expression of associated genes, despite variations of the sections in structure organization and rotations due to changes of the biopsy in 3D space and arbitrary placement on the barcoded array in SRT profiling (Fig. 3i and Additional file 2: Figs. S27-S32). The results indicate that the modules, although initially identified in layer 2, characterize general biological processes across the tissue and act as crucial components in other areas as well.
STModule identifies diverse biological signals from other cancersAs biological signals in tumors are intricate and heterogeneous, we applied STModule to another two datasets of human melanoma [51] and prostate cancer [5] profiled by ST to demonstrate tissue modules captured from various tissue types and cancer subtypes. In the melanoma dataset, STModule identifies similar components from the two samples, including cancer cells (I), transition areas (II), lymphoid tissue (III; CD74, CD52, MS4A1), immune activities (IV-VI), CAFs, and melanocytes (GAPDH) (Fig. 4a–c and Additional file 2: Figs. S33-S39). The cancer cell modules (I) of the two samples are characterized by distinct marker genes, i.e., PMEL, ATP1A1, and SPP1 in sample 1 whereas S100B and PSAP in sample 2, in line with previous studies [6, 51, 91]. The transition areas (II) that encompass both cancer cells and immune cells as defined in the original study [51] exhibit high expression of FTL, CTSB, and HLA-associated genes (e.g., HLA-A, HLA-B, HLA-C), indicating immune infiltration in the TME.
Fig. 4
Application of STModule to other cancers. a,b Spatial maps of tissue modules identified by STModule from sample 1 (a) and sample 2 (b) of a melanoma dataset, including melanoma (I), transition area (II), and lymphoid tissue (III), along with spatial expression of representative associated genes. Colors indicate module activities or gene expression levels at different spots. c Histological annotations of the melanoma samples in the original study [51], including areas of melanoma (black), lymphoid (yellow), and stroma (red). d Results of domain clustering methods. e Histological annotations of samples P1.2 and P4.2 of prostate cancer in the original study [5] demonstrating regions of cancer Gs 3 + 3 (red), prostatic intraepithelial neoplasia (PIN) (orange), and chronic inflammation in stroma (purple). f Spatial maps of tissue modules identified by STModule from prostate sample P1.2 along with spatial expression of representative associated genes, including cancer (I −), PIN (I +), shared features of cancer and PIN (II), and center of cancer (III). g Spatial map of module I identified by STModule from prostate sample P4.2 representing inflammation along with spatial expression of associated gene AQP3. h The most highly enriched Gene Ontology terms of modules I and II in f. Color indicates the value of − log10(P-value). Dashed grey lines represent the threshold of P-value = 0.05. i Results of domain clustering methods. Colors indicate different clusters. j Comparison of the methods in terms of correlation and ARI of identifying major domains. k GSEA of associated genes detected by the methods. White color indicates adjusted P-value \(\ge\) 0.05
We included two samples from the prostate cancer dataset for their distinct pathological features, i.e., cancer (Gs 3 + 3) and prostatic intraepithelial neoplasia (PIN) in sample P1.2 and chronic inflammation in sample P4.2 (Fig. 4e). PIN is characterized by neoplastic growth of epithelial cells within pre-existing benign prostatic acini or ducts, and high-grade PIN is considered as the putative precursor of prostatic carcinoma [92, 93]. STModule identifies three tissue modules related to cancer cells from sample P1.2, among which module I discriminates between cancer cells (SPINK1, FMOD, AGR2) and PIN (NPY, ACPP, DBI), module II reveals shared features of cancer and PIN (SPON2, TFF3), and module III aligns with the center of the cancer region as annotated in the original study [5] (Fig. 4f, h). The modules potentially imply different pathological signals in prostate cancer progression, including early tumorigenesis of PIN expressing high levels of NPY [94], proliferation, metastasis, and invasion of tumor with overexpression of SPON2 and TFF3 in PIN and cancer cells compared to normal glands [95, 96], and unique alterations in cancer cells such as elevated expression of SPINK1 [97]. The center of the cancer (III) demonstrates high expression of LIPF, which can generate free fatty acids for cancer cells to uptake [98]. For sample P4.2, STModule identifies signal of inflammation (I; AQP3) and spatial expression of ATF3 (II), which plays an important role in regulating immune responses and exhibits dual functions as an oncogene or tumor suppressor [99] (Fig. 4g and Additional file 2: Fig. S40). Other modules are illustrated in Additional file 2: Figs. S40-S46 and discussed in Additional file 1: Supplementary notes.
STModule detects diverse tissue modules from melanoma and prostate cancer, capturing both tissue-/cancer-specific signals and fundamental components of tumors. It uncovers a greater variety of spatial structures with biological significance in comparison to other methods (Fig. 4d, i, Additional file 2: Fig. S47a, b and Fig. S48a, b), especially intricate signals associated with cancer progression, distinct activities of the immune landscape and convoluted structures of epithelial cells. In these two datasets, STModule also outperforms other methods in revealing the corresponding components and genes (Fig. 3j, k, Additional file 2: Fig. S47c-e and Fig. S48c, d).
STModule dissects spatial structure organization of brain tissuesThe brain has a unique and complex spatial structure that corresponds to its functions. We applied STModule to a human DLPFC dataset (10 × Visium) [56] and a mouse hippocampus dataset (Slide-seqV2) [15] respectively to demonstrate tissue modules identified from different components of the brain. The human DLPFC dataset comprises 12 tissue sections collected from three donors along with manually annotated structures including six cortical layers and a white matter (WM) region (Additional file 2: Fig. S49). STModule captures structural layers of DLPFC samples through tissue modules induced by differential spatial expression patterns of gene sets among the layers. For instance, tissue modules identified from section 151676 reveal structures of layer 1 (I; AQP4, MT1G), layer 2 (II + ; HPCAL1, CAMK2N1), layer 4 (III + ; SNCG, NEFM), layer 5 (II − ; PCP4, TMSB10), WM (IV + ; MBP, PLP1), and neurons (IV − ; SNAP25), as well as spatial expression of the astrocytic marker GFAP (III −) (Fig. 5a, b, Additional file 2: Fig. S50 and Fig. S51). Layer 3 and layer 6 are not explicitly represented by the tissue modules, likely because they are not well depicted by maker genes including those identified in previous studies [56, 100] (Additional file 2: Fig. S52). Nevertheless, the gaps between the modules of other layers may offer insights into the overall architecture of the tissue section and assist experts in structural dissection. Additionally, STModule recognizes another module signifying the spatial expression of a gene set comprising SCGB2A2, SCGB1D2, MUC1, TFF1, and TFF3 (Fig. 5a, module V). While SCGB2A2 and SCGB1D2 are reported as markers of breast cancer [101], their roles in human brain have not been exhaustively investigated.
Fig. 5
Results of the human dorsolateral prefrontal cortex (DLPFC) (a-g) and mouse hippocampus (h-m) datasets. a Spatial maps of tissue modules identified by STModule from DLPFC sample 151676 along with spatial expression of representative associated genes. b Illustration of cortical layers (1 to 6) and white matter (WM) of DLPFC sample 151676 annotated by the original study [56]. c Results of domain clustering methods. Colors indicate different clusters. d Spatial maps of tissue modules identified by STModule from DLPFC sample 151510 (left) and spatial expression of representative associated genes (right). e Illustration of spatial structure of DLPFC sample 151510 annotated by the original study. f Comparison of the methods in layer identification for all twelve samples in the DLPFC dataset, evaluated by AUROC (left) and ARI (right). g GSEA of associated genes detected by the methods for DLPFC sample 151676. White color indicates adjusted P-value \(\ge\) 0.05. h Spatial maps of tissue modules identified by STModule from the mouse hippocampus dataset profiled by Slide-seqV2. DG-sg, granule cell layer of dentate gyrus. CA3sp, pyramidal layer of cornu ammonis 3. CA1sp, pyramidal layer of cornu ammonis 1. i Spatial expression of representative associated genes of the tissue modules in h. j Annotation of mouse hippocampus structure from Allen Brain Atlas. k Results of domain clustering methods for the hippocampus sample. Colors indicate different clusters. l Comparison of the methods in terms of correlation and ARI of identifying major components of the hippocampus sample. m GSEA of associated genes detected by the methods for the hippocampus sample. White color indicates adjusted P-value \(\ge\) 0.05 or not applicable
For a representative sample 151510 collected from another individual showing a different layout, STModule also identifies tissue modules indicating layers 1 (I +), 2 (II −), 5 (II +), WM (I −), and neurons (IV +) characterized by gene sets concordant with sample 151676, as well as spatial expression of SCGB2A2 (III) and GFAP (V) (Fig. 5d, e and Additional file 2: Fig. S53). Genes associated with layer 4 in sample 151676, such as NEFH, NEFL, and NEFM (Additional file 2: Fig. S51), do not distinguish the layer in sample 151510 (Additional file 2: Fig. S54), leading to the absence of the module in this sample. However, it is successfully recovered by applying the tissue modules of sample 151676 to sample 151510 as the spatial maps are summarized from the associated genes, as well as the other tissue modules (Additional file 2: Fig. S55). Individual markers may not act as reliable indicators of layers. In contrast, tissue modules based on common expression patterns of gene sets are less susceptible to variability and heterogeneity across individuals. As another example, AQP4 is a representative gene associated with layer 1 (Fig. 5a, d) and reported as a marker gene in the original study [56], but not able to differentiate layer 1 in all samples (Additional file 2: Fig. S56).
Certain clusters identified by spatial domain clustering methods appear to be tangled together rather than neatly arranged layer by layer, and some layers are not recognized, especially thin layers such as 1, 2, and 4 (Fig. 5c and Additional file 2: Fig. S49). One possible reason is that some layers are differentiated by small gene sets whose expression patterns are not discerned with current clustering granularity in the methods. Another reason is that the clustering process is likely confused by spatial expression of genes that are not layer-specific markers, e.g., SCGB2A2 and SCGB1D2. SpatialDE and SPARK only identify structures of layer 1 and WM, probably hindered by the detected SVGs (Additional file 2: Fig. S57). We quantitatively evaluated and compared the performance of the methods in identifying each layer for all twelve samples in the dataset (Methods). STModule is superior to the other methods with higher ARI and AUROC in layer identification (Fig. 5f) while detecting associated genes enriched of layer-specific genes in most cases (Fig. 5g and Additional file 2: Fig. S58).
Mouse hippocampus exhibits an “arrow-like” structure instead of stacked layers in DLPFC (Fig. 5j). STModule detects components of hippocampus including granule cell layer of dentate gyrus (DG-sg) (Olfm1), pyramidal layers of cornu ammonis 1 (CA1sp) (Chgb) and 3 (CA3sp) (Atp2b1), pyramidal neurons (Malat1), third ventricle (V3) (Ttr), fiber tracts (Mbp), medial habenula (MH) (Nwd2), and meninges (Ptgds) (Fig. 5h, i, Additional file 2: Fig. S59 and Fig. S60). STModule and SpatialPCA capture more components than other methods, dissecting the basic structure of mouse hippocampus (Fig.
Comments (0)