
Remember me
A total of 20 patients were included in the study; 11 (55%) were male and 9 (45%) were female. The median age was 61 years (interquartile range [IQR] 48.5–68 years). Admission to Oslo University Hospital was generally early after ictus (median 0 days, IQR 0–1 days, range 0–8 days). On admission to our hospital, the median Glasgow Coma Scale score was 6.5 (IQR 4–11, range 3–14), and the median World Federation of Neurosurgical Societies score was 4.5 (IQR 4–5, range 2–5).
Regarding aneurysm location, the aSAH was from an anterior circulation aneurysm (6/20 anterior communicating artery; 5/20 middle cerebral artery; 4/20 posterior communicating artery; 1/20 internal carotid artery; 1/20 anterior cerebral artery) in 17/20 (85%) of patients and from a posterior circulation aneurysm (1/20 vertebral artery; 1/20 basilar artery; 1/20 posterior inferior cerebellar artery) in 3/20 (15%) of patients.
Aneurysm repair was performed in 19/20 patients, whereas one patient was treated conservatively. Endovascular techniques were used in 9/19 (47%) patients, surgical clipping was used in 9/19 (47%) patients, and a combined sequential surgical and endovascular approach was used in one (5%) patient. Aneurysm repair was generally initiated early after admission (median 0 days, IQR 0–1 days, range 0–6 days) both for coiling (median 0 days, IQR 0–1 days, range 0–1 days) and clipping (median 0, IQR 0–1, range 0–6 days). One patient underwent delayed surgical clipping due to the presence of significant cerebral vasospasm on admission.
Optic Nerve Sheath ExaminationsA total of 26 ultrasound examinations were performed in the 20 included patients. In all but one patient, both eyes were examined, and values averaged between eyes. In the remaining single examination in the one patient, aberrant anatomy with apparent optic nerve atrophy was noted, and therefore unilateral values were recorded. It was later discovered that the patients had known severe unilateral glaucoma explaining the finding.
Serial examinations were performed in four patients, and in these patients the number of examinations ranged between two and three. Median time of ultrasound examination was 5 days (IQR 3–10 days; range 1–16 days) after ictus and 3.5 days (IQR 2–5 days; range 1–16 days) after admission to our hospital.
At the time of ultrasound examination, all patients were on a ventilator, and the median Richmond Agitation-Sedation Scale score was − 4 (IQR − 4 to − 5). All patients had an EVD in-situ. The EVD was open against external resistance in 18/26 (69%) of examinations (median resistance 2.5 cm H2O, IQR 0–5 cm H2O, range 0–10 cm H2O) and was closed in the remaining examinations.
At time of ultrasound examination, patients had been treated by surgical clipping in 12/26 (46%) instances, by coiling in 11/26 (42%) instances, by both coiling and clipping in 1/26 (4%), and in 2/26 (8%) instances the aneurysm had not been repaired.
In 8/26 (31%) instances, the basal cisterns had been surgically entered before ultrasound examination. These entrances to the basal cisterns were more specifically related to clip ligation of anterior communicating artery aneurysms (four patients, four examinations), obtaining proximal control for a middle cerebral artery aneurysm (one patient, three examinations) and clip ligation of a posterior communicating artery aneurysm (one patient, one examination). The median time from surgical entrance of the basal cisterns to ultrasound examination was 2.5 days (IQR 1–3.5 days, range 1–10 days).
At time of ultrasound examination, ICP was actively managed in 24/26 of instances, while in the remaining two instances (two patients), active management of the neurological condition, including ICP management, had been withdrawn.
Invasive ICP and CPPInvasive mean ICP values recorded at the time of examination ranged between 0 and 88 mm Hg (median 9 mm Hg; IQR 4–17 mm Hg). In all but two examinations, the ICP ranged between 0 and 22 mm Hg. The two outliers (ICP 59 mm Hg and 88 mm Hg) corresponded to examinations performed in the two patients in which active management had been withdrawn. In these patients, CPP was near zero (− 4 mm Hg and 2 mm Hg), indicating tamponade or near-tamponade. In the remaining actively managed patients, the CPP ranged between 64 and 100 mm Hg (median 75 mm Hg, IQR 71–85 mm Hg).
Regarding the distribution of ICP values, a Shapiro–Wilk test indicated that the distribution of values significantly deviated from normality (W 0.62, p < 0.001). Graphically, this deviation from normality appeared clearly related to the two outliers (Supplemental Fig. 1). Both exclusion of the outliers and natural log transformation of ICP (ln[ICP]) (one missing value due to ICP being 0 mm Hg) led to distributions approaching normality with Shapiro–Wilk tests indicating that distributions no longer significantly deviated from normality (W = 0.98; p = 0.93 and W = 0.92; p = 0.055 respectively). QQ-plots showing the distributions are shown in Supplemental Fig. 1. Correlation and regression results after exclusion of the two outliers are reported in the following sections while results after log transformation are reported in Supplemental Fig. 2.
Fig. 2
Association between ONSD and ICP in the whole cohort and in subgroups by surgical entrance to the basal cisterns. Scatterplots showing observations with correlations coefficients R. Top: whole cohort. Bottom left: basal cisterns not surgically entered before ultrasound examination. Bottom right: basal cisterns surgically entered before ultrasound examination. Blue dots indicate observations in patients who were under active management, whereas navy dots indicate observations in patients in whom active management, including ICP and CPP management, had been withdrawn. ICP, intracranial pressure, ONSD, optic nerve sheath diameter, CPP, cerebral perfusion pressure
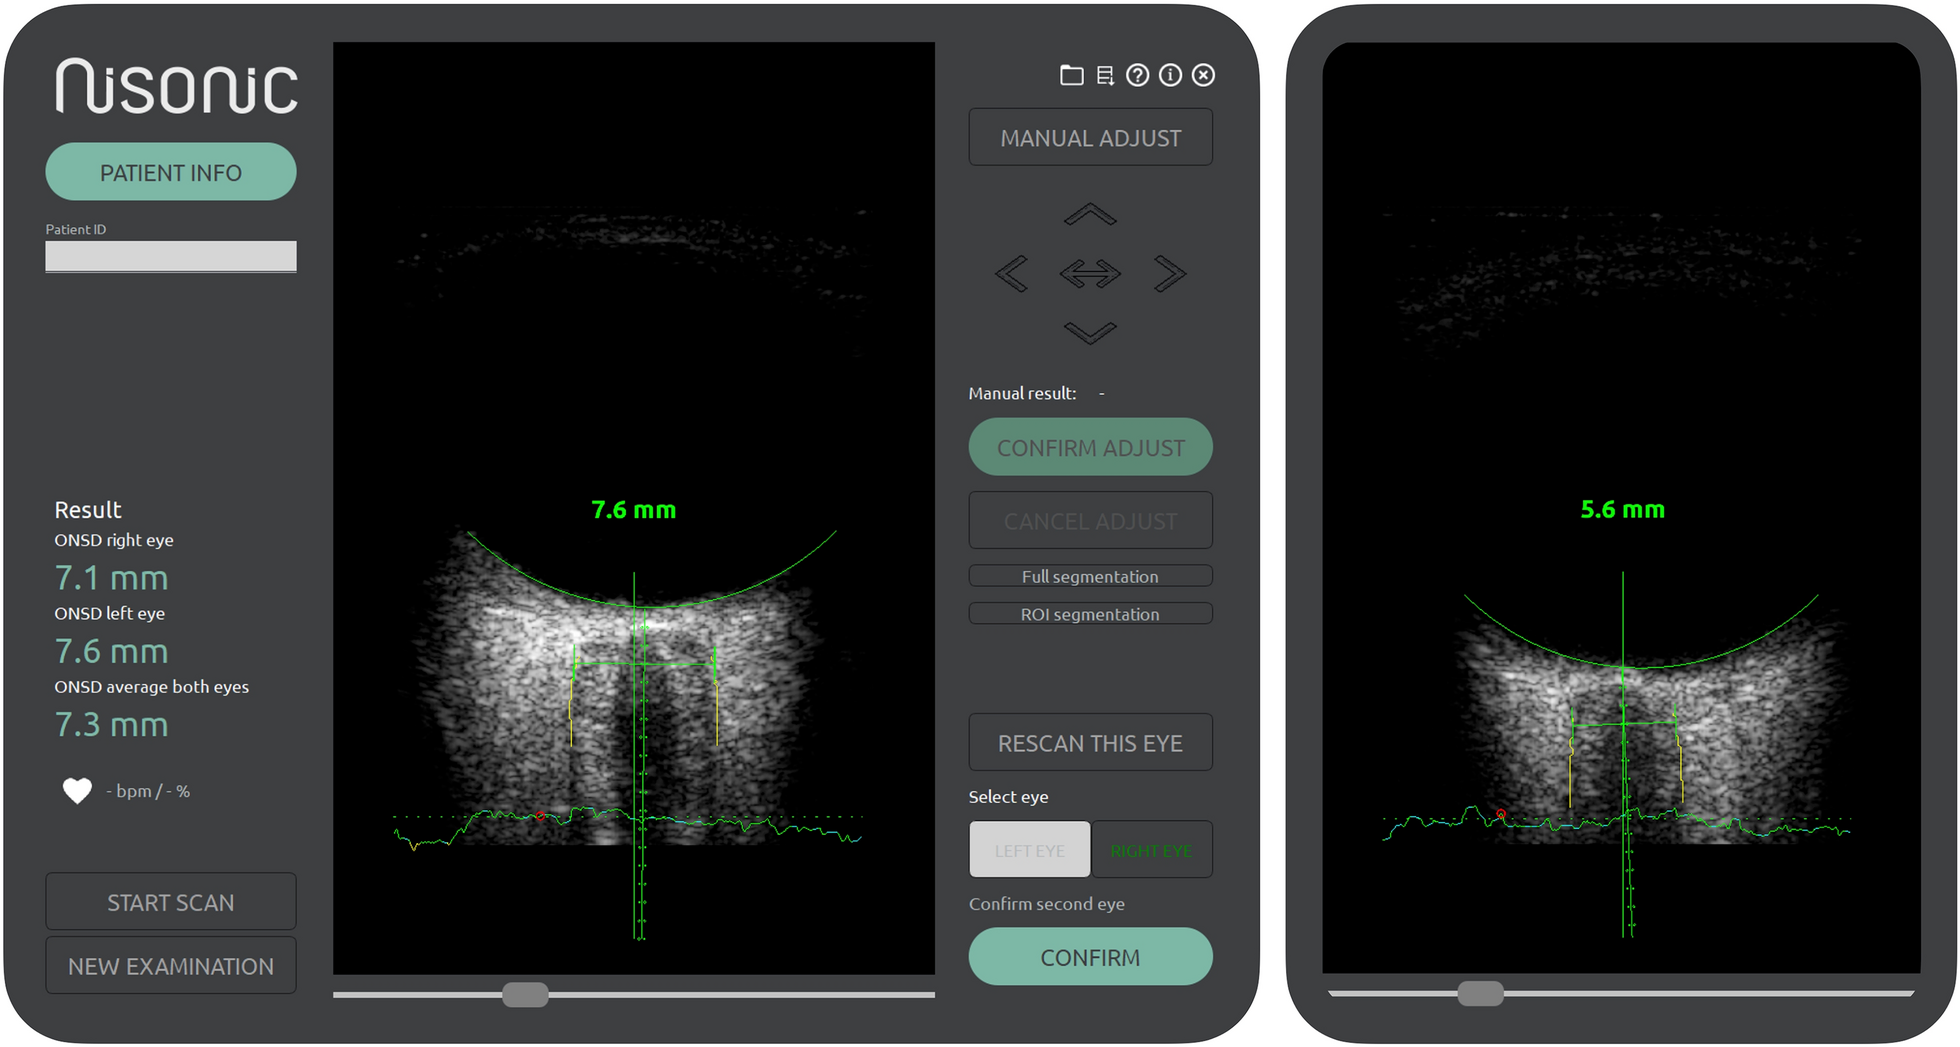
ONSDAutomatically measured ONSD ranged between 4.66 mm and 7.32 mm (median 5.82 mm, IQR 5.57–6.49 mm).
Generally, there was a very good agreement between the two eyes in those with bilateral examinations (n = 25), with a median difference of 0.07 mm (IQR − 0.18 to 0.32 mm; range − 1.17 to 0.87 mm).
Regarding the distribution of ONSD, values approximated normal distribution (Supplemental Fig. 1) and a Shapiro–Wilk test indicated no significant deviation from normality (W = 0.96; p = 0.49).
Association, Correlation, and Linear RegressionThere was an association between ONSD and ICP with a positive correlation (Pearson R 0.43; p = 0.03). Scatter plots of ONSD against ICP values are shown in Fig. 2.
In subgroups by whether the basal cisterns had been surgically entered before ultrasound examination, a stronger correlation (Pearson R = 0.55, p = 0.01) was seen in those in whom the basal cisterns had not been surgically entered (n = 18 examinations) as compared with the whole cohort. Conversely, in those in whom the basal cisterns had been surgically entered (n = 8), no association between ONSD and ICP was observed (Pearson R = − 0.16; p = 0.70) (Fig. 2).
When restricting observations to those in whom patients were under active management, thereby excluding the two ICP outliers, correlation increased to Pearson R = 0.59; p = 0.002 for the whole cohort (n = 24 examinations) and to R = 0.78; p < 0.001 for the subgroup where the basal cisterns had not been entered (n = 16 examinations) (Fig. 3). When fitting the same observations in linear regression models, results showed that ONSD significantly predicted ICP, both in the whole cohort (R2 = 0.35, F(1, 22) = 11.93, p = 0.002), with the equation ICPPredicted = − 24.68 + 5.70 × ONSD, and in the subgroup where the basal cisterns had not been entered (R2 = 0.60, F(1, 14) = 21.25, p < 0.001), with the equation ICPPredicted = − 35.76 + 7.45 × ONSD. Regression lines with 95% CIs are shown in Fig. 3.
Fig. 3
Association between ONSD and ICP in patients under active management (exclusion of ICP outliers). Scatterplots showing observations with correlation coefficients R and associated regression lines with 95% confidence intervals. Top: whole cohort under active management. Bottom left: basal cisterns not surgically entered before ultrasound examination. Bottom right: basal cisterns surgically entered before ultrasound examination. ICP, intracranial pressure, ONSD, optic nerve sheath diameter
Ability to Discriminate Dichotomized ICPAnalysis by dichotomization at ICP ≥ 15 mm Hg showed a significant difference in the distribution of ONSD values between the groups (high ICP n = 9: median ONSD 6.63 mm, 95% CI 5.75–7.00; and low ICP n = 17: median ONSD 5.70, 95% CI 5.52–5.96; p = 0.005). In subgroups by whether the basal cisterns had been surgically entered, a significant difference in ONSD was withheld in those in whom the basal cisterns had not been surgically entered (high ICP n = 4: median ONSD 6.82 mm,,95% CI 6.49–7.32 mm; and low ICP n = 14: median ONSD 5.65 mm, 95% CI 5.29–5.92 mm; p = 0.003), whereas in those in whom the basal cisterns had been surgically entered, no difference was seen (high ICP n = 5: median ONSD 6.03 mm, 95% CI 5.63–6.96 mm; and low ICP n = 3: median ONSD 6.46 mm, 95% CI 5.52–7.21; p = 0.88). Box plots graphically showing median, IQR, and ranges are displayed in Fig. 4.
Fig. 4
Distribution of ONSD values for ICP dichotomized at ≥ 15 mm Hg. Box plots showing median and interquartile range, and whiskers showing range. Left: whole cohort. Middle: basal cisterns not surgically entered before ultrasound examination. Right: basal cisterns surgically entered before ultrasound examination. ICP, intracranial pressure, ONSD, optic nerve sheath diameter
ROC analysis gave an AUC of 0.84 (95% CI 0.65–0.96) for the whole cohort. In subgroups by whether the basal cisterns had been surgically entered, ROC analysis revealed a perfect discriminatory ability (AUC 1, 95% CI 0.81–1) in those in whom the basal cisterns had not been surgically entered (n = 18 examinations) and no discriminatory ability (AUC 0.47, 95% CI 0.16–0.84) in those in whom the basal cisterns had been surgically entered. ROC curves are shown in Fig. 5.
Fig. 5
Ability to discriminate dichotomized ICP. Receiver operating characteristics curves. ICP cutoff at ≥ 15 mm Hg. Left: whole cohort. Middle: basal cisterns not surgically entered before ultrasound examination. Right: basal cisterns surgically entered before ultrasound examination. AUC, area under the curve, ICP, intracranial pressure
Comments (0)