Region
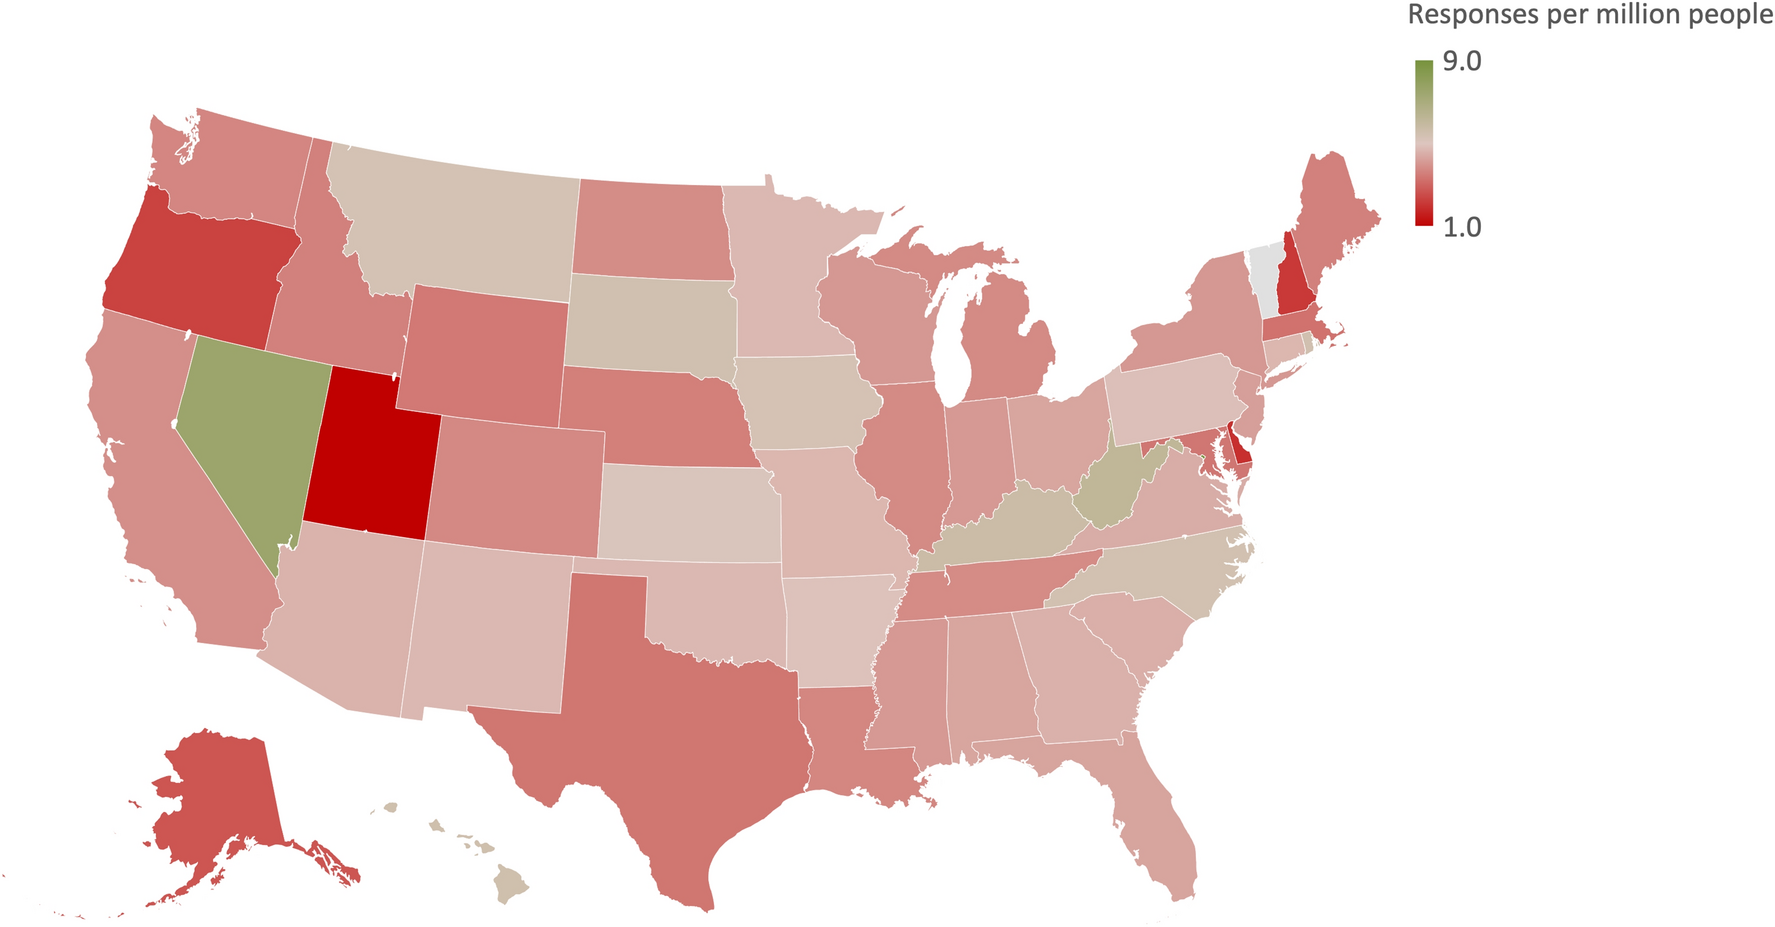
There were no regional differences in agreement toward further treatment (F(3, 1383) = 1.39, p = 0.25) and CPR (F(3, 1383) = 1.70, p = 0.16) for the patient in the vignette, and no differences in agreement for treatment for oneself (F(3, 1383) = 1.89, p = 0.13). The only group regional difference came in requesting further treatment for a family member after brain death determination (F(3, 1383) = 3.04, p = 0.028). Post hoc analysis showed that respondents from the Midwest had less agreement compared with respondents in the Northeast (\( }_\) = − 0.46, 95% CI − 0.82 to − 0.01) for requesting further treatment for a family member. A state-by-state distribution of responses to the four attitude measures can be found in the Supplemental Information (Fig. S1).
Sex
Female respondents had more agreement for further treatment (\( }_\) = 0.23, 95% CI 0.03–0.43) for the patient in the vignette and less agreement for further treatment for a family member (\( }_\) = − 0.24, 95% CI − 0.46 to − 0.02), although the average score among female respondents for further treatment was between “neither agree nor disagree” and “somewhat agree.” There were no differences between men and women for requiring CPR (\( }_\) = − 0.03, 95% CI − 0.25 to 0.20) and requesting further treatment for oneself (\( }_\) = 0.19, 95% CI − 0.04 to 0.42).
Age
There were differences between age groups for the requirement to continue treatment for the patient in the vignette (F(5, 1381) = 19.60, p < 0.001), to perform CPR on the patient in the vignette (F(5, 1381) = 14.79, p < 0.001), to request treatment for oneself (F(5, 1381) = 27.52, p < 0.001), and to request treatment for a family member (F(5, 1381) = 28.69, p < 0.001). Respondents who were greater than 65 years of age had significantly less agreement on all four measures compared with respondents in the 18–24, 25–34, 35–44, and 45–54 age groups. Similarly, respondents from the 54–65 age bracket had significantly less agreement across all four measures compared with respondents in the 18–24, 25–34, 35–44, and 45–54 age groups. Group differences were still present across all four measures after including quiz scores as a covariate.
Religion
Univariate ANOVA indicated a difference between Christian, Buddhist, Jewish, and Islamic participants for the requirement to continue treatment for the patient in the vignette (F(3, 1383) = 5.76, p < 0.001), to perform CPR on the patient in the vignette (F(3, 1383) = 4.27, p < 0.001), to request treatment for oneself (F(3, 1383) = 13.89, p < 0.001), and to request treatment for a family member (F(3, 1383) = 12.69, p < 0.001). Analysis of covariance with religious commitment and five-item quiz score as covariates did not change the effect size across all four measures. Islamic respondents had more favorable attitudes (i.e., more agreement for continued treatment after the determination of brain death) compared with Christian and Jewish respondents, corresponding to an average between “somewhat agree” and “agree” on all four attitude measures (Table 4).
Table 4 Descriptive statistics for attitudes across demographic variables. Reported as average score (SD)There were differences between the Christian religions for the requirement to continue treatment for the patient in the vignette (F(3, 858) = 11.08, p < 0.001), to perform CPR on the patient in the vignette (F(3, 858) = 7.49, p < 0.001), to request treatment for oneself (F(3, 858) = 12.41, p < 0.001), and to request treatment for a family member (F(3, 858) = 9.67, p < 0.001). Post hoc analysis showed that Protestant respondents had significantly less agreement on all four measures compared with all other Christian groups.
Political Affiliation
Furthermore, univariate ANOVA showed differences between political affiliations for the requirement to continue treatment for the patient in the vignette (F(3, 1383) = 2.87, p = 0.022), to perform CPR on the patient in the vignette (F(3, 1383) = 3.67, p < 0.01), to request treatment for oneself (F(3, 1383) = 3.10, p = 0.015), and to request treatment for a family member (F(3, 1383) = 2.47, p < 0.01). Post hoc analysis indicated that Democrats had stronger agreement to further treatment for themselves (\( }_\) = 0.44, 95% CI 0.03–0.86), a family member (\( }_\) = 0.43, 95% CI 0.02–0.83), and the patient in the vignette (\( }_\) = 0.39, 95% CI 0.02–0.76) compared to Independents. Democrats also had greater agreement for further CPR for the patient in the vignette (\( }_\) = 0.43, 95% CI 0.05–0.80) compared with Republicans (Table 4). However, even though Democrats had relatively more agreement for further treatment, their averages for further treatment for oneself and family member were between “somewhat disagree” and “neither agree nor disagree.” Similarly, Democrats’ averages for further treatment and CPR for the stranger were between “neither agree nor disagree” and “somewhat agree.”
Race and Ethnicity
There were differences between race and ethnicity for the requirement to continue treatment for the patient in the vignette (F(6, 1382) = 5.99, p < 0.001), to perform CPR on the patient in the vignette (F(6, 1382) = 7.64, p < 0.001), to request treatment for oneself (F(6, 1382) = 10.53, p < 0.001), and to request treatment for a family member (F(6, 1382) = 14.43, p < 0.001). Post hoc analysis showed that White participants had the least agreement to further treatment or CPR compared with all other races and ethnicities (Table 3). Among Non-White groups, those identifying as African American or Black had the most agreement for continued treatment for themselves and a family member, although their average responses were between “neither agree nor disagree” and “somewhat agree” (Table 4).
Income Level
There were differences in attitude across levels of income for the requirement to continue treatment for the patient in the vignette (F(3, 1383) = 7.21, p < 0.001), to perform CPR on the patient in the vignette (F(3, 1383) = 8.80, p < 0.001), to request treatment for oneself (F(3, 1383) = 6.96, p < 0.001), and to request treatment for a family member (F(3, 1383) = 4.41, p < 0.01). Post hoc analysis showed that the respondents in the lowest income bracket had more favorable attitudes toward requiring further treatment compared with those in the $25,000–$49,999 (\( }_\) = 0.51, 95% CI 0.09–0.92), $50,000–$99,999 (\( }_\) = 0.67, 95% CI 0.28–1.03), and > $100,000 (\( }_\) = 0.44, 95% CI 0.03–0.85) brackets. However, the average score for respondents in the lowest income bracket was between “neither agree nor disagree” and “somewhat agree.” These differences remained significant after including quiz scores as a covariate.
Education Level
There were also differences between education levels for the requirement to continue treatment for the patient in the vignette (F(3, 1383) = 5.76, p < 0.001) and to request treatment for a family member (F(3, 1383) = 4.94, p = 0.02). Post hoc analysis showed that respondents with a Bachelor’s degree had significantly less agreement to further treatment for the patient in the vignette (\( }_\) = − 0.46, 95% CI − 0.82 to − 0.10) and for treatment for a family member (\( }_\) = − 0.53, 95% CI − 1.01 to − 0.04) compared with those with less than a college degree. There were no differences between levels of education in attitude for performing CPR on the patient in the vignette (F(3, 1385) = 1.22, p = 0.23) or requesting treatment for oneself (F(3, 1385) = 1.90, p = 0.066).
Linear Regression Model for Predicting Attitudes Toward Continued Treatment
Linear regression analysis was performed to investigate what variables predict response to requiring the hospital to continue treatment in the setting of brain death objection (Table 5). A backward variable selection yielded six independent variables: requesting further treatment for oneself, requesting further treatment for a family member, highest level of education, five-item knowledge score, male sex, and misunderstanding that the patient depicted in the vignette was alive according to U.S. laws (Table 5). The model predicted Likert scale responses for requiring continued treatment in the setting of brain death objection, F(6, 1380) = 142.74, adjusted R2 = 0.38, p < 0.001. The largest positive regression coefficients for predicting attitudes toward requiring further treatment were attitudes toward continuing treatment for oneself and continuing treatment for a family member after the determination of brain death. The largest negative regression coefficients were male sex and understanding that brain death is legal death. The model did not demonstrate collinearity with each factor’s tolerance > 0.10. The independence of residuals was demonstrated with a Durbin-Watson statistic of 2.03.
Table 5 Results of a multiple linear regression model for attitudes towards requiring further treatment for a brain-dead patient after family objection 
Comments (0)