
Remember me

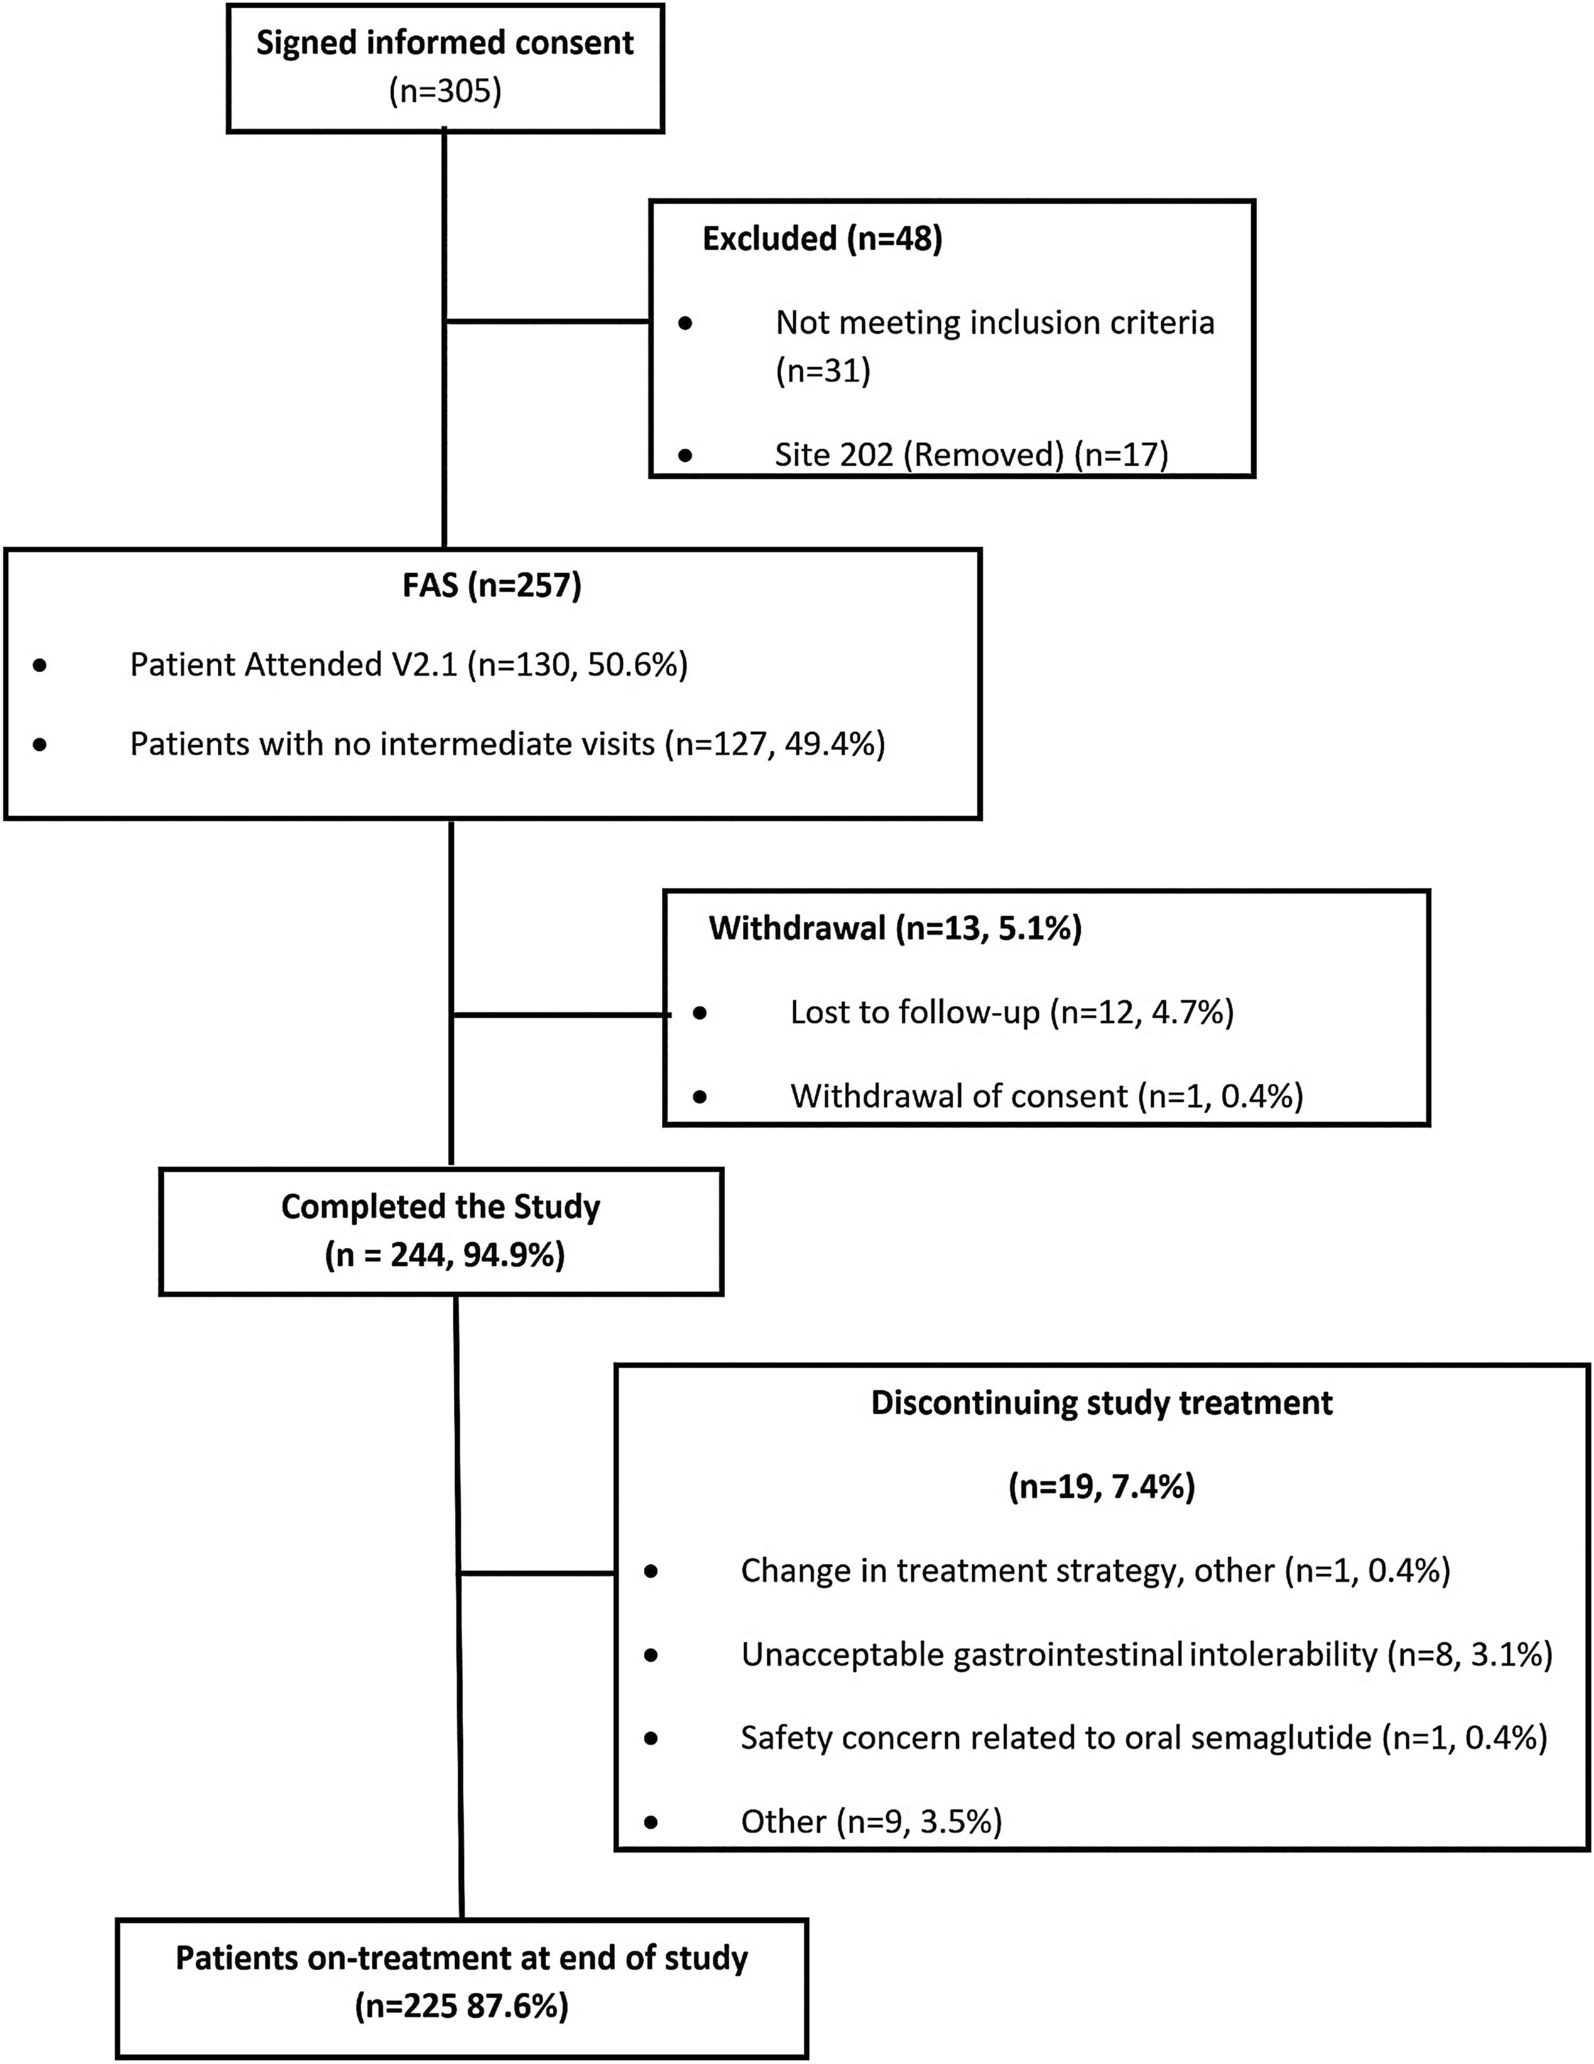

A summary of the disposition of patients is provided in Fig. 1. Of the 305 patients recruited, 257 patients were included in the full analysis set (FAS). A total of 130 patients (50.6%) attended the intermediate visit V2.1. Patients who completed the study comprised 244 patients (94.9%). Thirteen patients (5.1%) discontinued their treatment; 12 (4.7%) were lost to follow-up, and 1 (0.4%) withdrew consent. At study end, 225 patients (87.6%) were still on-treatment. Treatment discontinuation occurred in 19 patients (7.4%) as a result of various reasons (Fig. 1). The mean follow-up period was 80 (± 25) days, range (1–39 days). The median duration was 84 days, with an interquartile range from 68 to 96 days.
Fig. 1
Patient disposition. FAS full analysis set, V2.1 optional intermediate visits
The main baseline characteristics are presented in Table 1. Patients had a mean (standard deviation, SD) baseline HbA1c of 6.8 (1.2) % and a mean T2DM duration of 8.7 (6.6) years. At baseline, 113 patients (43.9%) were on a 7-mg dose of oral semaglutide, while 144 (56.0%) were on the 14-mg dose. The average treatment duration with oral semaglutide was 149.0 days (SD 106.0), with a range of 28 to 515 days. Metformin was the most commonly used concomitant OAD, taken by 209 patients (88.2%), followed by dapagliflozin and empagliflozin, used by 102 (43.0%) and 92 (38.8%) patients, respectively. Biguanides, sodium glucose cotransporter 2 (SGLT2) inhibitors, and sulfonylureas were the leading OAD classes, with usage rates of 88.2%, 82.7%, and 30.0%, respectively.
Table 1 Descriptive summary of demographical and clinical characteristics of patients at baselinePatients’ diabetes history and associated complications are presented in Supplementary Material Table S1, diabetes medication history and history of other concomitant medications in Supplementary Material Tables S2 and S3, respectively.
Exposure to Oral Semaglutide and Other OADs During the Study PeriodBefore the enrolment, patients were treated with oral semaglutide for a mean duration of 227.7 days (SD 111.2), with a range of 69 to 609 days. Treatment discontinuation occurred in 19 patients (7.4%), primarily due to gastrointestinal intolerance (3.1%), changes in treatment strategy (0.4%), safety concerns (0.4%), or other reasons (3.5%). Among the 237 patients with available OAD data, adjustments were made for 15 patients. Specifically, 7 patients (2.7%) had an OAD added, or their dose increased, while 8 patients (3.4%) experienced a reduction or discontinuation of an OAD.
Oral semaglutide intake patterns and outcomes were tracked using patient diaries across pre-Ramadan, Ramadan, and post-Ramadan periods. Diary completion rates were 50.2% (n = 129) pre-Ramadan, 83.3% (n = 214) during Ramadan, and 49.8% (n = 128) post-Ramadan. Regular fasting was observed in 84.7% (n = 182) of patients during Ramadan, 1.6% (n = 2) pre-Ramadan, and 14.6% (n = 19) post-Ramadan. Pre-Ramadan, 38.8% (n = 50) of patients were on a 7-mg dose, 53.5% (n = 69) on 14 mg, and 7.8% (n = 10) transitioned from 7 to 14 mg. During Ramadan, 41.1% (n = 88) were on 7 mg, 50.9% (n = 109) on 14 mg, and 7.9% (n = 17) transitioned. Post-Ramadan, 43.0% (n = 55) were on 7 mg, 55.5% (n = 71) on 14 mg, and 1.6% (n = 2) transitioned from 7 to 14 mg (Table 2).
Table 2 Descriptive summary of oral semaglutide intake routine by periodAssessment of Glycaemic Control and Body WeightChanges in HbA1c from baseline to the end of study (EOS) were assessed in the FAS (n = 257). The baseline HbA1c was 6.8% (SD 1.2), with an estimated mean of 6.6% at EOS. The mean change was − 0.2%-points (standard error, SE 0.1), 95% CI − 0.4 to − 0.1, p = 0.01 (Fig. 2a). In the adjusted model (n = 223), the estimated mean HbA1c at EOS was 6.6%, with a mean change of − 0.2%-points (SE 0.1), 95% CI − 0.5 to − 0.04, p = 0.02 (Fig. 2b).
Fig. 2
a Summary of crude MMRM for change from baseline in HbA1c (%) to end of follow-up visit. Covariates: baseline HbA1c, time, time squared. b Summary of adjusted MMRM for change from baseline in HbA1c (%) to end of follow-up visit). Covariates: baseline HbA1c, time, time squared, age, diabetes duration, BMI, fixed effect, sex, study site. BMI body mass index, FAS full analysis set, HbA1c glycated haemoglobin, MMRM mixed models for repeated measures, SE standard error
A total of 238 patients contributed to the MMRM analysis for weight change. The observed mean weight at baseline was 89.8 kg (SD 18.7). The estimated mean weight at EOS was 87.3 kg, with a mean relative change of − 3.0% (SE 0.5), 95% CI − 4.0 to − 2, p < 0.0001 (Fig. 3). The mean absolute change in body weight from baseline to EOS was − 2.6 kg (SE 0.4), 95% CI − 3.5 to − 1.8, p < 0.0001 (Fig. 4).
Fig. 3
a Relative change in mean body weight (%) from baseline to end of follow-up visit (week 20). Crude model (in-study) (MMRM). Covariates: baseline body weight, time, time squared. b Relative change in mean body weight (%) from baseline to end of follow-up visit (week 20). Adjusted model (in-study) (MMRM). Covariates: baseline body weight, time, time squared, age, diabetes duration, BMI, fixed effect, sex, study site. BMI body mass index, CI confidence interval, FAS full analysis set, MMRM mixed models for repeated measures, SE standard error
Fig. 4
a Absolute change in mean body weight (kg) from baseline to end of follow-up visit (week 20). Crude model (in-study). Covariates: baseline body weight, time, time squared. b Absolute change in mean body weight (kg) from baseline to end of follow-up visit (week 20). Adjusted model (in-study). Covariates: baseline body weight, time, time squared, age, diabetes duration, BMI, fixed effect, sex, study site. BMI body mass index, CI confidence interval, FAS full analysis set, SE standard error
Impact of Adherence to Oral Semaglutide Dosing Instructions on Glycaemic Control and Body WeightAdherence to oral semaglutide administration instructions was evaluated pre-, during, and post-Ramadan. The instruction to wait at least 30 min after taking the medication was followed by 92.3% (n = 119) pre-Ramadan, 80.0% (n = 172) during Ramadan, and 90.7% (n = 117) post-Ramadan. For taking the medication with up to 120 mL of water, adherence was 84.5% (n = 109) pre-Ramadan, 83.7% (n = 180) during Ramadan, and 95.3% (n = 122) post-Ramadan. Regarding taking the medication on an empty stomach, adherence was 93.0% (n = 120) pre-Ramadan, 92.1% (n = 198) during Ramadan, and 93.8% (n = 121) post-Ramadan (Fig. 5, Table 2). These high adherence rates indicate strong compliance across all periods. Oral semaglutide intake timing shifted to align with Iftar (the meal eaten to break the fast at sunset) and Suhoor (the pre-dawn meal before the fast begins and meals during Ramadan, while early morning intake was common pre- and post-Ramadan (Table 2).
Fig. 5
Adherence to oral semaglutide administration instructions. a Waited for at least 30 min after taking oral semaglutide. b Oral semaglutide on empty stomach. c Oral semaglutide with up to 120 mL of water
Of the 215 patients who recorded administration details in their diaries, 68.4% (n = 147) adhered to dosing instructions for ≥ 80% of diary days. In the adherent group, there was a significant decrease in HbA1c from a mean baseline of 6.7% to 6.4% at week 20 (mean change − 0.3%, 95% CI − 0.4 to − 0.2, p < 0.0001). For the 68 participants who were not adherent, the HbA1c reduction was insignificant, changing from a mean baseline of 7.0% to 6.9% at week 20 (mean change − 0.1%-points, 95% CI − 0.4 to 0.1, p = 0.3). Adjusted models showed similar results (Table 3).
Table 3 ANCOVA for change from baseline in HbA1c (%) and body weight (kg) to end of follow-up visit (week 20): FAS (in-study)Adherent patients (n = 147) experienced a significant reduction in body weight, decreasing from 90.9 kg at baseline to 87.9 kg at week 20, a relative decrease of − 3.2% (SE 0.4; 95% CI − 4.0 to − 2.4; p < 0.0001) and an absolute reduction of − 2.9 kg (SE 0.4; 95% CI − 3.6 to − 2.2; p < 0.0001). Non-adherent patients (n = 65) also experienced weight loss, from 90.9 kg at baseline to 89.4 kg, a relative change of − 1.6% (SE 0.4; 95% CI − 2.5 to − 0.8; p = 0.0001) and an absolute reduction of − 1.6 kg (SE 0.4; 95% CI − 2.4 to − 0.9; p < 0.0001). All observed changes remained statistically significant after adjusting for covariates (Table 3).
Hypoglycaemic EventsSelf-reported hypoglycaemic events showed variation across the study periods, with 8.5% (n = 11) of patients experiencing hypoglycaemic events pre-Ramadan, 24.2% (n = 52) during Ramadan, and 10.0% (n = 13) post-Ramadan. The total number of hypoglycaemic events was 24 pre-Ramadan, 249 during Ramadan, and 24 post-Ramadan. The mean (SD) number of hypoglycaemic events per patient was 2.2 (1.5) pre-Ramadan, 4.8 (6.9) during Ramadan, and 1.9 (1.5) post-Ramadan (Table 2).
Among patients with available data on hypoglycaemic episodes (n = 216), 67 patients (31%) experienced hypoglycaemic events. The mean age (SD) of patients who reported hypoglycaemic events was 51.0 (9.7) years, whereas for those without episodes, it was 53.3 (9.5) years. The average duration (SD) of T2DM was 9.2 (5.2) years for patients in the hypoglycaemic events group and 7.9 (6.7) years for the no hypoglycaemic events group.
Medication data was available for 95.5% of patients with hypoglycaemic episodes, with 90.6% using biguanides and 85.9% (n = 55) using SGLT2 inhibitors. In the no hypoglycaemic events group, data was available for 90.6% (n = 135) of the patients, with 86.7% (n = 117) using biguanides and 80.7% (n = 109) using SGLT2 inhibitors. Dual therapy was the most common medication regimen across the combination medication cohort (45.5%), particularly among those reporting hypoglycaemic events (50%) (Supplementary Material Table S4). Demographics and clinical characteristics at baseline for patients with and without hypoglycaemic episodes during each treatment period (pre-Ramadan, post-Ramadan, and during Ramadan) are presented in Supplementary Material Table S5.
An analysis to estimate the incidence rate ratios (IRRs) for hypoglycaemic events was conducted for the pre-Ramadan, Ramadan, and post-Ramadan periods. During the pre-Ramadan period, among 128 patients, there were 10 hypoglycaemic events, resulting in an observed rate of 3.7 events per person-year and an estimated rate of 3.9 events per person-year. During Ramadan, 215 patients were analysed, with 52 individuals experiencing a total of 249 hypoglycaemic events, leading to an observed rate of 16.0 events per person-year and an estimated rate of 16.1 events per person-year. Notably, 19.2% of patients discontinued fasting after experiencing a hypoglycaemic event (Fig. 6a). Post-Ramadan, the analysis included 125 patients, with 13 experiencing a total of 24 hypoglycaemic events. The observed rate was 3.3 events per person-year, with an estimated rate of 4.1 events per person-year (Fig. 6b).
Fig. 6
a Negative binomial regression model for hypoglycaemic events (incidence rate between pre-Ramadan and Ramadan period). b Negative binomial regression model for hypoglycaemic events (incidence rate between Ramadan and post-Ramadan period). CI confidence interval, FAS full analysis set, IRR incidence rate ratio. O-SEMA-FAST: a prospective, non-interventional study investigating oral semaglutide use in adults with type 2 diabetes mellitus during Ramadan
Other Safety OutcomesDuring the study involving 257 patients, 105 (40.9%) experienced at least one adverse event (AE). Gastrointestinal disorders were the most frequently reported AEs, affecting 98 patients (38.1%). These included nausea (27.6%, n = 71), constipation (15.6%, n = 40), diarrhoea (14.8%, n = 38), and vomiting (12.8%, n = 33). Metabolism and nutrition disorders were noted in 15 patients (5.8%), primarily hypoglycaemia affecting 13 patients (5.1%). Of these, one case was confirmed as level 1 hypoglycaemia per American Diabetes Association guidelines [6]. Decreased appetite was reported in 2 patients (0.8%), with other AEs affecting fewer than 1.6% of participants. (Supplementary Material Table S6). Gastrointestinal side effects such as nausea, constipation, and diarrhoea varied in frequency before, during, and after Ramadan (Table 2). There were no reports of hyperglycaemic episodes.
Regarding AE causality, 331 of 382 AEs (86.9%) were classified as ‘Probable’, 15 as ‘Possible’ (3.9%), and 35 as ‘Unlikely’ (9.2%). The majority of AEs were mild in severity (374 AEs, 97.9%), with 7 moderate (1.8%) and 1 severe (0.3%) AE reported. One technical complaint (0.3%) related to the medication was recorded. Of all AEs, 358 (93.7%) were resolved or recovered, 4 (1.1%) recovered with sequelae, and 16 (4.2%) had an unknown outcome.
The 105 patients who reported AEs had a mean age of 52.1 years (SD 9.2), with 59.1% being male. Among these, 44 (41.9%) were on a 7-mg dose and 61 (58.1%) on a 14-mg dose of the study medication. Post-AE interventions included no dose change for 81 patients (77.1%), dose increase for 1 patient (1.0%), dose decrease for 2 patients (1.9%), temporary drug interruption for 6 patients (5.7%), drug withdrawal for 9 patients (8.6%), and for 6 patients (5.7%), the intervention was unspecified (Supplementary Material Table S7).
Subgroup Analyses During RamadanMedication Timing During RamadanFor this subgroup analysis, data was available for 158 patients of which 123 patients (77.8%) took oral semaglutide at Iftar, resulting in a significant reduction in HbA1c from a baseline of 6.8% to 6.4% by EOS (mean change − 0.4%-points, 95% CI − 0.5 to − 0.2, p < 0.0001). After adjustiment for covariates, the reduction remained significant (mean change − 0.3%, 95% CI − 0.4 to − 0.2, p < 0.0001). Conversely, 35 patients (22.2%) taking medication at Suhoor did not experience a significant change in HbA1c (mean change − 0.2%-points, 95% CI − 0.3 to 0.0, p = 0.1211; adjusted − 0.2%, 95% CI − 0.4 to 0.1, p = 0.1829) (Table 3).
Patients who took oral semaglutide during Iftar (n = 122) also showed a significant weight reduction from a baseline of 91.5 kg to 88.6 kg at EOS, a mean relative decrease of − 3.2% (SE 0.5; 95% CI − 4.1 to − 2.2; p < 0.0001) and an absolute reduction of − 2.9 kg (SE 0.4; 95% CI − 3.7 to − 2.1; p < 0.0001). Patients taking oral semaglutide during Suhoor (n = 37) also experienced substantial weight loss, from 87.5 kg to 85.3 kg, with a relative change of − 2.5% (SE 0.5; 95% CI − 3.6 to − 1.4; p < 0.0001) and an absolute decrease of − 2.1 kg (SE 0.6; 95% CI − 3.2 to − 0.9; p = 0.0007). These changes remained statistically significant after covariate adjustment for both the Iftar and Suhoor groups (Table 3).
BMIPatients with a BMI < 30 kg/m2 experienced a significant reduction in HbA1c from baseline to EOS, with a crude decrease of − 0.2% (95% CI − 0.4 to − 0.01; p = 0.04), which remained significant after adjustment for covariates at − 0.2% (95% CI − 0.4 to − 0.1; p = 0.01). Patients with a BMI ≥ 30 kg/m2 showed a decrease of − 0.3% (95% CI − 0.4 to − 0.2; p < 0.0001) in crude model, and − 0.3% (95% CI − 0.4 to − 0.2; p < 0.0001) after adjustments (Table 3).
Patients with a baseline BMI < 30 kg/m2 (n = 88) also experienced a significant decrease in body weight from 76.8 kg at baseline to 75.3 kg at week 20, with a relative change of − 2.0% (SE 0.5; 95% CI − 3.1 to − 0.96; p = 0.0003) and an absolute reduction of − 1.6 kg (SE 0.4; 95% CI − 2.4 to − 0.89; p < 0.0001). Conversely, those with a baseline BMI ≥ 30 kg/m2 (n = 147) saw their weight decrease from 98.1 kg to 95.0 kg, reflecting a relative change of − 3.1% (SE 0.3; 95% CI − 3.7 to − 2.5; p < 0.0001) and an absolute change of − 2.9 kg (SE 0.3; 95% CI − 3.5 to − 2.3; p < 0.0001) (Table 3).
Baseline HbA1cPatients with a baseline HbA1c level < 7% did not experience a statistically significant change in HbA1c from baseline to week 20, showing a crude mean reduction of − 0.03%-points (95% CI − 0.10 to 0.04; p = 0.4), which remained not significant after adjustment for covariates with a change of − 0.04%-points (95% CI − 0.12 to 0.03; p = 0.3). In contrast, patients with a baseline HbA1c > 7% had a significant reduction in HbA1c, with a crude mean decrease of − 0.7%-points (95% CI − 0.9 to − 0.5; p < 0.0001), which remained significant in the adjusted model, with a decrease of − 0.7%-points (95% CI − 1.0 to − 0.5; p < 0.0001) (Table 3).
Patients with baseline HbA1c levels < 7% (n = 155) had a significant decrease in body weight from 92.2 kg to 90.0 kg at EOS, translating to a relative change of − 2.5% (SE 0.3; 95% CI − 3.0 to − 1.9; p < 0.0001) and an absolute reduction of − 2.2 kg (SE 0.3; 95% CI − 2.3 to − 1.7; p < 0.0001). Similarly, those with baseline HbA1c levels > 7% (n = 80) experienced a decrease from 86.1 kg to 83.3 kg, resulting in a relative change of − 3.2% (SE 0.6; 95% CI − 4.4 to − 2.0; p < 0.0001) and an absolute weight loss of − 2.9 kg (SE 0.5; 95% CI − 3.9 to − 2.0; p < 0.0001) (Table 3).
Recent and Later Initiators of Oral SemaglutideOn the basis of the timing of oral semaglutide initiation, patients were categorized into recent initiators, who began treatment within 6 months prior to baseline, and later initiators, who started treatment more than 6 months before baseline. Recent initiators (n = 186) demonstrated a significant reduction in HbA1c from a baseline mean of 6.8% to 6.5% at EOS, with a mean change of − 0.3%-points (95% CI − 0.4 to − 0.2; p < 0.0001). Later initiators (n = 71) also showed a significant decrease from 6.7% to 6.5%, with a mean change of − 0.2%-points (95% CI − 0.4 to − 0.1; p = 0.007). After adjustment for covariates, the reductions remained significant: − 0.3%-points for recent initiators (95% CI − 0.4 to − 0.2; p < 0.0001) and − 0.2%-points for later initiators (95% CI − 0.4 to − 0.001; p = 0.04) (Table 3).
Recent initiators also experienced a significant weight reduction, with their body weight decreasing from a baseline average of 90.8 kg to 88.1 kg at EOS. This change represents a relative reduction of − 3.0% (SE 0.3; 95% CI − 3.6 to − 2.4; p < 0.0001) and an absolute decrease of − 2.6 kg (SE 0.3; 95% CI − 3.2 to − 2.1; p < 0.0001). Later initiators (n = 64) also had a significant weight decrease, from an initial 88.5 kg to 86.7 kg, resulting in a relative change of − 2.0% (SE 0.6; 95% CI − 3.3 to − 0.7; p = 0.002) and an absolute reduction of − 2.0 kg (SE 0.5; 95% CI − 2.9 to − 1.0; p < 0.0001) (Table 3).
Dosing Regimen and Glycaemic ControlPatients receiving the 7-mg dose of oral semaglutide pre-Ramadan (n = 104) demonstrated a significant reduction in HbA1c levels from a baseline mean of 6.9% to 6.6% at EOS, with a mean change of − 0.3%-points (95% CI − 0.4 to − 0.1; p = 0.0002). Patients on a 14-mg dose (n = 126) also had significant decrease, from a baseline of 6.7% to 6.5%, with a mean change of − 0.3%-points (95% CI − 0.4 to − 0.1; p < 0.0001). Adjustments for covariates confirmed these results, showing a mean change of − 0.3%-points (95% CI − 0.4 to − 0.1; p = 0.0003) for the 7-mg group, and − 0.3%-points (95% CI − 0.4 to − 0.1; p = 0.0005) for the 14-mg group (Table 3).
Patients receiving the 7-mg dose of oral semaglutide pre-Ramadan (n = 105) experienced a significant reduction in body weight, decreasing from an average of 87.8 kg to 85.2 kg at EOS, equating to a relative decrease of − 3.0% (SE 0.4; 95% CI − 3.7 to − 2.2; p < 0.0001) and an absolute change of − 2.6 kg (SE 0.4; 95% CI − 3.3 to − 1.9; p < 0.0001). Similarly, those on the 14-mg dose (n = 130) had a decrease from 92.1 kg to 89.7 kg, a relative reduction of − 2.5% (SE 0.4; 95% CI − 3.3 to − 1.7; p < 0.0001) and an absolute reduction of − 2.4 kg (SE 0.3; 95% CI − 3.0 to − 1.7; p < 0.0001) (Table 3).
Comments (0)