
Remember me

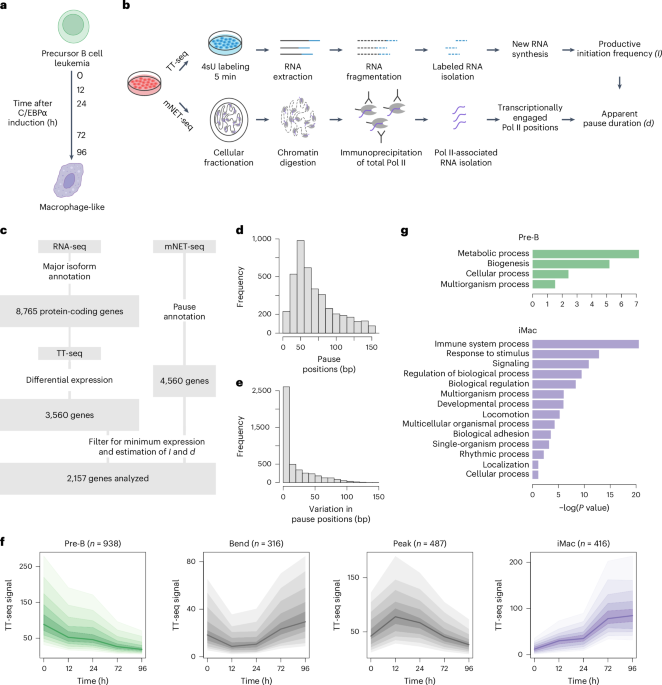

We used the previously obtained engineered human BLaER1 cell line stably expressing C/EBPα fused to the estrogen receptor hormone-binding domain and GFP48,50. The BLaER1 cell line is derived from precursor leukemia B cells that can be efficiently transdifferentiated into functional macrophage-like cells upon estrogen induction48,50. Cells were cultured in the growth medium consisting of RPMI 1640 (Thermo Fisher Scientific, 31870-074) supplemented with 10% FBS (Thermo Fisher Scientific, 10500-064), 4 mM GlutaMAX (Thermo Fisher Scientific, 35050087), 25 mM HEPES (Thermo Fisher Scientific, 15630080) and 100 U per ml penicillin–streptomycin (Thermo Fisher Scientific, 15140122) at 37 °C and 5% CO2. Biological replicates were cultured independently. BLaER1 cells were regularly examined and tested negative for the Mycoplasma contamination using Plasmo Test Mycoplasma detection kit (InvivoGen, rep-pt1).
TreatmentsTo induce transdifferentiation, BLaER1 cells were brought to a density of 0.4 × 10⁶ cells per ml and mixed with 100 nM β-estradiol (Sigma-Aldrich, E2758-250MG), 10 ng ml−1 recombinant human interleukin 3 (PeproTech, 200-03) and 10 ng ml−1 recombinant human macrophage colony-stimulating factor (PeproTech, 300-25) in the growth medium50. For the 0-h control, BLaER1 cells were treated with the same concentration of solvents (ethanol and water). Cells were harvested at different time points: 0, 12, 24, 72 and 96 h after induction for RNA extraction and mNET-seq, 0, 24 and 96 h after induction for ChIP-seq and 0 and 96 h after induction for ChIP-nexus. To inhibit transcription initiation, BLaER1 cells were collected at 0 or 96 h of transdifferentiation, brought to a density of 1 × 10⁶ cells per ml and treated with 5 µM triptolide (Sigma-Aldrich, T3652) or DMSO (Sigma-Aldrich, D2438) as a solvent control.
Total RNA extraction and RT–qPCRCell pellets were resuspended in QIAzol Lysis Reagent (Qiagen, 79306) and incubated at room temperature for 5 min. Total RNA was extracted according to the manufacturer’s instructions (Qiagen). To eliminate genomic DNA contamination, total RNA was treated with the TURBO DNA-free Kit (Thermo Fisher Scientific, AM1907) according to the manufacturer’s instructions. Complementary DNA synthesis was performed using Maxima H Minus reverse transcriptase (Thermo Fisher Scientific, EP0753) according to the manufacturer’s instructions. qPCR was conducted with SYBR Select Master Mix (Thermo Fisher Scientific, 4472919) according to the manufacturer’s instructions. Primer sequences used for qPCR are listed in Supplementary Table 1.
mNET-seqmNET-seq was performed as described previously52,53,62 with minor modifications. Briefly, two independent biological replicates of BLaER1 cells were subjected to transdifferentiation and collected at 0, 12, 24, 72 and 96 h after induction. Cells were further used in the amount of 2 × 10⁸ per replicate per time point. All buffers were supplemented with protease inhibitor cocktail (Sigma-Aldrich, P8340) and phosphatase inhibitors (Millipore Sigma, 4906837001). After washing with DPBS (Thermo Fisher Scientific, 14190169), cellular fractionation of 2 × 10⁷ cells per reaction was performed according to the previously published protocol63. Isolated chromatin was subjected to micrococcal nuclease (New England Biolabs (NEB), M0247S) digestion at 37 °C and 1,400 rpm for 90 s followed by stopping the reaction with 25 mM EGTA (Bioworld, 40520008-1). The solution was clarified by centrifugation at 4 °C and 13,000g for 5 min and the supernatants corresponding to the same sample were pooled and used for IP. Supernatant was diluted eightfold with IP buffer (50 mM Tris-HCl pH 7.4, 150 mM NaCl, 0.05% NP-40 and 0.3% empigen BB (Sigma-Aldrich, 30326)). RNA Pol II antibody (MBL Life science, MABI0601) was coupled to Dynabeads M-280 sheep anti-mouse IgG (Thermo Fisher Scientific, 11201D) according to the manufacturer’s instructions and added to the digested chromatin at 30 µg per 2 × 10⁸ cells. IP was performed at 4 °C and 8 rpm on a rotating wheel for 1 h. Afterward, beads were washed seven times with IP buffer and one time with PNKT buffer (1× T4 PNK buffer (NEB, M0236L) and 0.1% Tween-20). For 5′ RNA phosphorylation, beads were resuspended in PNK reaction mix (1× T4 PNK buffer (NEB, M0236L), 0.1% Tween-20, 1 mM ATP (Cell Signaling Technology, 9804S) and T4 polynucleotide kinase (phosphatase minus) (NEB, M0236L) and incubated at 37 °C and 800 rpm for 10 min. After the reaction, beads were washed one time with IP buffer and mixed with QIAzol lysis reagent (Qiagen, 79306) by vortexing for 1 min. RNA was extracted according to the manufacturer’s instructions (Qiagen). Precipitation of RNA was performed with GlycoBlue coprecipitant (Thermo Fisher Scientific, AM9515) in 100% ethanol overnight. RNA was size-selected in a range of 25–110 nt using a denaturing 6% polyacrylamide gel with 7 M urea. Then, RNA was extracted from the gel in elution buffer (1 M sodium acetate pH 5.5 and 1 mM of EDTA pH 8.0) on a rotating wheel and precipitated with GlycoBlue coprecipitant (Thermo Fisher Scientific, AM9515) in 100% ethanol overnight. RNA libraries were prepared with NEBNext Multiplex small RNA library prep set for Illumina (NEB, E7300S) according to the manufacturer’s instructions. Libraries were size-selected with 4% E-Gel high-resolution agarose gels (Thermo Fisher Scientific, G501804) and purified using QIAquick gel extraction kit (Qiagen, 28706X4) according to the manufacturer’s instructions. Concentration and fragment size distribution of the libraries were estimated using Fragment Analyzer (Agilent). Libraries were sequenced on Illumina NEXTseq 550 using 75 cycles paired-end mode.
ChIP-seqChIP-seq protocol was performed as described64 with minor modifications. Briefly, two biological replicates of 3 × 10⁷ BLaER1 cells were collected at 0, 24 and 96 h after transdifferentiation induction. For double crosslinking, cells were washed once with DPBS (Thermo Fisher Scientific, 14190169) and fixed in DPBS first with 2 mM DSG (Thermo Fisher Scientific, 20593) at room temperature for 20 min and then with 1% methanol-free formaldehyde (Thermo Fisher Scientific, 28908) at room temperature for 10 min. For quenching, 125 mM glycine (Sigma-Aldrich, 50046) was added to the cells and incubated at room temperature for 5 min. Fixed cells were spun down and washed twice with ice-cold DPBS (Thermo Fisher Scientific, 14190169). All the buffers were supplemented with protease inhibitor cocktail (Sigma-Aldrich, P8340) and phosphatase inhibitors (Millipore Sigma, 4906837001). The cell pellet was resuspended in Farnham lysis buffer (5 mM PIPES pH 8.0, 85 mM KCl and 0.5% NP-40) and incubated on ice for 10 min. Isolated nuclei were washed once with ice-cold DPBS (Thermo Fisher Scientific, 14190169) and resuspended in sonication buffer (10 mM Tris-HCl pH 7.5, 1 mM EDTA and 0.4% SDS) followed by incubation on ice for 10 min. Suspension was transferred into a 1-ml AFA milliTUBE (Covaris, 520130) and subjected to sonication using S220 focused ultrasonicator (Covaris) with the following parameters: duty cycle, 5%; peak incident power, 140 W; 200 cycles per burst; processing time, 960 s; bath temperature, 4–7 °C; continuous degassing mode; water level, 8. Sonicated chromatin was centrifuged at 4 °C and 10,000g for 15 min and supernatant was transferred to a new tube. DNA was quantified and analyzed on a 1% agarose gel to confirm a fragment size distribution of 200–500 bp. Antibodies were coupled to Dynabeads Protein G (Thermo Fisher Scientific, 10004D) according to the manufacturer’s instructions. The following antibodies were used: anti-cyclin T1 antibody (Cell Signaling, 81464) in the amount of 12.5 µl per sample, anti-CDK9 antibody (Abcam, ab239364) in the amount of 7.9 µg per sample and Drosophila anti-H2Av antibody (Active Motif, 61686) in the amount of 0.5 µg per sample. IP was performed with 50 µg chromatin per sample. Drosophila S2 spike-in chromatin was produced as previously described64 and added in the amount of 122 ng per sample. A total of 1% of each sample was kept as input and stored at 4 °C. Chromatin was diluted with IP buffer (56.25 mM Tris-HCl pH 7.5, 157.5 mM NaCl, 1 mM EDTA, 1.125% Triton X-100 and 0.1125% sodium deoxycholate) to obtain 0.1–0.05% SDS concentration. Chromatin was mixed with antibody–bead complexes and incubated on a rotating wheel at 4 °C overnight. On the next day, beads were washed five times with LiCl wash buffer (100 mM Tris-HCl pH 7.5, 500 mM LiCl, 1% NP-40 and 1% sodium deoxycholate) and one time with TE buffer (10 mM Tris-HCl pH 8.0 and 1 mM EDTA). DNA was eluted from the beads at 70 °C for 10 min and decrosslinked at 65 °C overnight along with input samples. DNA was subsequently treated with RNase A (Thermo Fisher Scientific, EN0531) and proteinase K (Thermo Fisher Scientific, AM2546) followed by precipitation in 100% ethanol. DNA concentration was measured with a Qubit 2.0 fluorometer (Thermo Fisher Scientific) and the IP enrichment over input was analyzed with RT–qPCR. Equal amounts of DNA were used for the library preparation with NEBNext Ultra II DNA library prep kit for Illumina (NEB, E7645S) according to the manufacturer’s instructions. Concentration and fragment size distribution of the libraries were estimated using Fragment Analyzer (Agilent). Libraries were sequenced on Illumina NEXTseq 550 using 75 cycles in paired-end mode.
ChIP-nexusTwo biological replicates of BLaER1 cells were collected at 0 and 96 h after transdifferentiation induction and treated with 5 µM triptolide (Sigma-Aldrich, T3652) or DMSO (Sigma-Aldrich, D2438) as described in Treatments section. For single crosslinking, 3e7 cells per condition were fixed in the growth media with 1% methanol-free formaldehyde (Thermo Fisher Scientific, 28908) at room temperature for 10 min. Cell lysis, nuclei isolation, chromatin shearing and quantification, IP were performed as described in ChIP-seq section. IP was performed with 60 µg chromatin per sample. Drosophila S2 spike-in chromatin was added in the amount of 244 ng per sample. For IP, the following antibodies were used: RNA Pol II NTD antibody (Cell Signaling, 14958) in the amount of 12 µl per sample, Drosophila H2Av antibody (Active Motif, 61686) in the amount of 1 µg per sample. After IP, all downstream steps were performed as described65 with minor modifications listed below. Amplified DNA libraries were size-selected using 4% E-Gel High-ReSolution Agarose Gels (Thermo Fisher Scientific, G501804) and purified using QIAquick Gel Extraction Kit (Qiagen, 28706×4) according to the manufacturer’s instructions. Concentration and fragment size distribution of the libraries were estimated using Fragment Analyzer (Agilent). Libraries were sequenced on Illumina NEXTseq 550 using 75 cycles paired-end mode.
Western blotting of the whole cell lysateTwo biological replicates of BLaER1 cells were collected at 0 and 96 h of transdifferentiation and treated with triptolide (Sigma-Aldrich, T3652) or DMSO (Sigma-Aldrich, D2438) as described above. A total of 3 × 10⁶ cells per each condition were collected by centrifugation at room temperature and 300g for 5 min. The cell pellet was resuspended in radioimmunoprecipitation assay buffer (50 mM Tris-HCl pH 8.0, 150 mM NaCl, 1% NP-40, 0.5% sodium deoxycholate and 0.1% SDS) supplemented with 500 U per ml benzonase (Sigma-Aldrich, E1014), 2 mM MgCl2, protease inhibitor cocktail (Sigma-Aldrich, P8340) and phosphatase inhibitors (Millipore Sigma, 4906837001). The lysate was incubated on ice for 20 min with occasional mixing and centrifuged at 4 °C and 21,123g for 15 min. The supernatant was transferred to a new tube and protein concentration was measured using Bradford assay (Bio-Rad, 5000006) according to the manufacturer’s instructions. A total of 7–10 µg of the protein was loaded in NuPAGE LDS sample buffer (Thermo Fisher Scientific, NP0007) supplemented with 400 mM DTT and subjected to SDS–PAGE (Bio-Rad) followed by the transfer to the PVDF membrane (Bio-Rad, 1704156). The membrane was blocked using 5% milk in PBS containing 0.05% Tween-20 (Sigma-Aldrich, P1379) and incubated using 2% milk in PBS containing 0.05% Tween-20 (Sigma-Aldrich, P1379) with the following primary antibodies: anti-RNA Pol II NTD antibody (Santa-cruz, sc-55492; dilution 1:200) and anti-GAPDH antibody (Sigma-Aldrich, G8795; dilution 1:20,000). Next, the membranes were washed in PBS containing 0.05% Tween-20 (Sigma-Aldrich, P1379) and incubated with horseradish peroxidase-coupled secondary anti-mouse antibody (Abcam, ab5870; dilution 1:3,000). After washing in PBS containing 0.05% Tween-20 (Sigma-Aldrich, P1379), the membranes were developed with Pierce ECL Plus western blotting substrate (Thermo Scientific, 32109) on an INTAS imager according to the manufacturer’s instructions.
Major isoform annotationSalmon version 1.3.0 (ref. 66) was used to quantify the counts for each isoform of a gene and to select the major isoforms from our RNA-seq dataset. An isoform of a gene from the GENCODE v24 GRCh38.p5 annotation was defined as major if it was present in an amount greater than 70% of the total mean transcripts per million for at least one of the time points in our analysis (0, 12, 24, 72 and 96 h after transdifferentiation induction) and if no other isoform of the same gene had this property at any other time point. Major isoforms for genes on chromosome M were discarded from further analysis. The final annotation contained 8,765 protein-coding genes with major isoforms called.
TT-seq data processing and normalizationTT-seq BAM files50 were processed in the R/Bioconductor environment. Read pairs were discarded from further analysis if they spanned a region other than the major isoforms plus 500 bases upstream and downstream. Expressed genes were defined as those having ten reads per kilobase mapped to them at at least one of the time points of data collection (0, 12, 24, 72 and 96 h after transdifferentiation induction). Read counts were generated using custom R scripts and corrected for antisense bias (ratio of spurious reads originating from the opposite strand introduced by the RT reactions) using antisense bias ratios obtained from positions in regions without antisense annotation with a coverage of at least 100 according to the defined major isoforms. The DESeq2 algorithm67 was used to calculate size factors to normalize the data used for all further analysis and to perform differential expression analysis.
Estimation of productive initiation frequencyProductive initiation frequency I was estimated in a similar way as described previously39,40 with minor modifications. To avoid bias from using different number of cells for different time points, we estimated I independent of the number of cells for our dataset. For each gene g, the productive initiation frequency Ig (estimated in arbitrary units (a.u.)) was calculated as
with TT-seq coverage covg and length Lg. Note that covg and Lg were restricted to nonfirst exons for multiexon genes and to 300 bp downstream of the TSS to pA for single-exon genes.
mNET-seq data processing and normalizationPaired-end reads of 75-bp length were collected for the samples. Quality check was performed using FastQC68. Reads were mapped to the human genome (GRCh38) using STAR aligner69. Further data processing was performed in the R/Bioconductor environment using custom scripts. To identify transcriptionally engaged Pol II positions, we took the last incorporated base (3′ end of the RNA), which is the first mapped base in read 2, and used only this position in downstream analyses. Counts were calculated for the annotated genes using a custom R script for regions of interest depending on the analysis. From the mNET-seq data, we calculated and corrected for antisense bias as described previously51,64. DESeq2 (ref. 67) size factors were calculated from the gene counts and used for normalization.
Detection of promoter-proximal pause sitesmNET-seq data were used to determine promoter-proximal Pol II occupancy peaks for the annotated genes. A gene was selected for downstream analysis if there was a clear maximum in the mNET-seq signal profile within the first 250 bp downstream of the TSS (that is, the maximum value had to be at least five times greater than the median of the nonzero values in this window). Such an mNET-seq peak was identified for 4,560 genes at at least one time point during transdifferentiation. Bias because of variations in the promoter-proximal peak position was reduced by further limiting the analysis to only those genes for which the peak position did not change substantially during transdifferentiation (s.d. between time points ≤ 75 bp). This resulted in a total of 4,309 genes with well-defined mNET-seq peaks in the promoter-proximal region, which were further used for the calculation of kinetic parameters.
Estimation of apparent pause durationApparent pause duration d of a gene g was defined as the ratio of mNET-seq signal within a window of 200 bp around the promoter-proximal mNET-seq peak positions (described above; pause window coverage, PWcov) to the respective I as described previously39,40. Contrary to the previously described approach, we did not use an additional normalization factor and estimations are, hence, in a.u. After removing the genes that had no TT-seq signal at one or more time points from the data, d was calculated for 2,157 DE protein-coding genes at all time points and this subset was used for further analysis related to promoter-proximal transcription regulation.
Classification and clustering of genesGenes were classified into four groups on the basis of their RNA synthesis changes. The upregulated and downregulated genes were identified by checking whether the TT-seq coverage was maximum or minimum at 0 h and 72 or 96 h, respectively. To identify differences in pause regulation of the upregulated iMac genes, we further clustered them on the basis of I and d together (k = 2) using a bootstrapped k-means clustering algorithm. To minimize bias, all clusterings were performed with multiple values of k before settling on those described in the results.
GO and protein–protein interaction analysisGO analysis for groups of genes was performed using DAVID70. GOTERM_BP_1 data from DAVID was used for the analysis, and the plots were generated using a custom R script. To investigate the interactions between proteins encoded by different sets of genes, we used the multiple protein functionality of the STRING database56. It was also used to generate the interaction networks, subcellular localization and reactome pathways.
ChIP-seq data processing and normalizationPaired-end reads of 75-bp length were collected for the samples. Reads were quality-checked using FastQC68. Reads were mapped to the human genome (GRCh38) using the Bowtie2 aligner71 with default parameters. Further data processing was performed in the R/Bioconductor environment using custom scripts. Duplicate reads were defined as those with the same start and end of mapped fragments and were discarded from the data. Reads with insert sizes greater than 500 bp were also discarded and the remaining reads were converted to run-length encoding (RLE) lists. Counts were calculated for the annotated genes using a custom R script for regions of interest. DESeq2 (ref. 67) size factors were calculated from the counts at the regions of interest and used for normalization.
ChIP-nexus data processing and normalizationChIP-nexus data were processed as described previously72 with minor modifications. Reads were checked for adaptor content using CutAdapt 2.3 (ref. 73) and any regions with adaptors were removed. Furthermore, to remove the region with barcodes, 9 bp from the 5′ ends of the reads were trimmed. Reads were then mapped using Bowtie2 (ref. 71) with default parameters to a combined human and Drosophila genome (dm6, GCF_000001215.4) and the samples showed an average of 74% mapping efficiency, consistent with data from the original ChIP-nexus publications42,72. Further data processing was performed as described previously72. Duplicates were removed on the basis of mapping locations and mapped reads were further trimmed to their 3′ end to extract the position of Pol II, before saving as RLE lists for further analysis. Drosophila spike-ins were used for normalization as described.
Estimation of promoter-proximal Pol II half-lifePol II ChIP-nexus coverages at identified peaks ±20 bp were used to estimate the half-life of Pol II in the promoter-proximal region. Genes with zero ChIP-nexus coverage in DMSO control or triptolide-treated samples were excluded from the half-life estimation, reducing the number of DE protein-coding genes from 2,157 to 1,877. In addition, the few genes with an observed increase in ChIP-nexus coverage in triptolide-treated samples were also excluded, leaving a final set of 1,814 genes for downstream analysis (pre-B, n = 833; iMac I, n = 146; iMac II, n = 162). For these genes, the normalized coverages for DMSO control and triptolide-treated samples were fit to an exponential decay model to estimate the decay constant (k) as described previously42. Half-lives were then calculated from the decay constant as ln 2/k.
Estimation of total turnover rate and termination fractionExponential fitting of the ChIP-nexus data can be used to estimate the rates of eviction of the polymerase from the promoter-proximal region. The half-life (t1/2) and the Pol II signal in the promoter-proximal region (p0) at a steady state provide the total Pol II turnover rate r:
$$r=\frac}p}}t}=-\mathrm\;2\times \frac_}_}$$
TT-seq data provide an estimate of the rate of promoter-proximal Pol II release into productive elongation in the form of productive initiation frequency I. If all the terms are exact and the calculations of r and I are free of bias, the promoter-proximal termination rate would be |r| − I. However, because this cannot be assumed, a useful quantity to measure the relative differences in the productive elongation fraction (proportion of initiated Pol II released into elongation) is I/|r|. A greater I/|r| for a gene indicates that more of its promoter-proximal Pol II is released into productive elongation and vice versa. An estimate of the termination fraction in the promoter-proximal region can then be derived as 1 − I/|r|.
This quantity gives a relative estimate of the promoter-proximal termination fraction up to a proportionality constant.
Statistics and reproducibilityAll comparisons were performed using the Kolmogorov–Smirnov test in R. No statistical method was used to predetermine sample size. No data were excluded from the analyses. The experiments were not randomized. The investigators were not blinded to allocation during experiments and outcome assessment.
Reporting summaryFurther information on research design is available in the Nature Portfolio Reporting Summary linked to this article.
Comments (0)