
Remember me
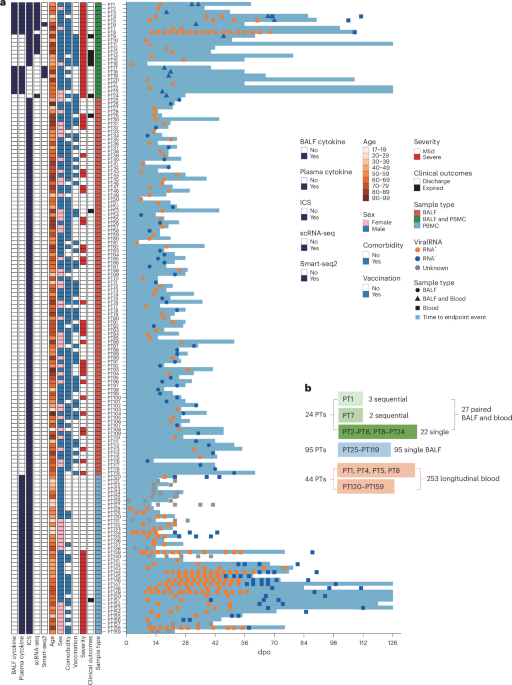

In this study, we enrolled 159 patients with COVID-19 from the First Affiliated Hospital of Guangzhou Medical University between January 2020 and January 2023. The cohort included individuals infected with the wild-type, Delta, and BA.5 strains, all of whom were experiencing their primary SARS-CoV-2 infection at the time of enrollment. The median age of participants was 64 years (interquartile range (IQR) = 52–76), including 98 males (61.6%) and 61 females (38.4%) (Fig. 1a and Extended Data Table 1). Among these patients, 55 patients (34.6%) had BIs after receiving inactivated COVID-19 vaccines (CoronaVac or BBIBP-CorV), while 104 patients (65.4%) were unvaccinated at the time of natural infection (NI) (Fig. 1a and Extended Data Table 1). The cohort included 81 mild (51%) and 78 severe (49%) cases, with nine fatalities (5.7%) (Fig. 1a and Extended Data Table 1). Over 70% of patients had comorbidities, with hypertension being the most prevalent (50.4%) (Extended Data Table 1). Twenty-four patients (PT1–PT24) provided 27 paired BALF and peripheral blood mononuclear cells (PBMC) samples, with PT1 contributing samples at three time points and PT7 at two time points; 95 patients (PT25–PT119) provided only BALF samples, each at a single time point; 44 patients (PT1, PT4, PT5, PT8 and PT120–PT159) contributed a total of 253 longitudinal blood samples (Fig. 1).
Fig. 1: Study design and patient cohort.
a, Schematic overview of patient demographics, sample details, and omics assays used in this study. The x axis represents the days after disease onset, while the y axis lists the patient IDs (PT1–PT159). Patient IDs are prominently displayed in the central column. Comorbidities depicted include hypertension, diabetes, chronic pulmonary diseases, cancer, coronary artery disease, stroke, history of organ transplantation, and chronic renal disease. b, Summary of patients who provided BALF and PBMC samples in this study. For additional details, see Extended Data Table 1.
Robustly elicited SARS-CoV-2-specific T cells in BALFWe assessed SARS-CoV-2-specific T cell responses in alveoli and peripheral blood using intracellular cytokine staining (ICS) after stimulation with a SARS-CoV-2 peptide library (S/N/M/E/ORF) (Extended Data Fig. 1b). In paired BALF and PBMC samples from patient PT1 at three sequential time points, virus-specific T cells were detected in the lungs as early as 16 days post symptom onset (dpo), increasing notably by 1 month after disease onset, while remaining at low levels in peripheral blood (Fig. 2a). Stronger virus-specific T cell responses were observed in BALF compared to paired PBMC samples (Fig. 2b,c), which was extended by the analysis of 114 BALF and 272 PBMC samples from 111 and 55 patients, respectively (Fig. 2d,e). Moreover, the time since symptom onset positively correlated with the abundance of virus-specific CD4+ and CD8+ T cells in BALF, but not in PBMCs. This finding was further confirmed in the correlation analyses (Fig. 2k,l). Notably, no correlation was observed between the proportion of specific T cells in BALF and PBMCs (Fig. 2f,g), suggesting distinct immune dynamics in the lung and peripheral compartments.
Fig. 2: Robust specific T cell responses in the BALF of patients with COVID-19.
a, Representative flow plotting of specific CD4+ and CD8+ T cells expressing IFNγ and TNF upon SARS-CoV-2 peptide stimulation in paired samples from human alveoli (BALF) and blood (PBMCs) collected over three sequential days post symptom onset from patient PT1. b,c, Summary plots comparing the frequencies of IFNγ+CD4+ (b) and IFNγ+CD8+ T (c) cells between 18 paired BALF and PBMC samples from 15 patients. Each dot represents an individual sample. Statistical significance was assessed using a two-tailed Wilcoxon matched-pairs signed-rank test. d,e, Kinetics of antigen-specific T cell responses in BALF (d) and PBMCs (e) after symptom onset. The number of patients and samples (ns/np) is indicated in the top left corner. Analysis was performed using a linear mixed model fit by restricted maximum likelihood (REML) (βdpo, fixed effects estimate), with t-tests based on Satterthwaite’s method. f,g, Two-tailed Spearman correlation analysis of specific CD4+ (f) and CD8+ (g) T cell responses between 18 paired BALF and PBMC samples from 15 patients. h,i, Comparison of specific CD4+ (h) and CD8+ (i) T cell responses in BALF between mild and severe patients with NI and BI. Data are shown as mean ± s.e.m. The number of samples (ns) and patients (np) is indicated in each panel. Statistical analysis was conducted using two-way analysis of variance. j, Two-tailed Spearman correlation analysis between specific CD4+ and CD8+ T cell responses in 114 BALF samples from 111 patients. The shaded area represents the 95% confidence interval (CI). k,l, Spearman correlation analysis of specific CD4+ (k) and CD8+ (l) T cells in BALF with the indicated clinical parameters. The number of samples and patients for each analysis is indicated (ns/np). Two-tailed multiple comparisons were corrected using the Benjamini–Hochberg method. Spearman correlation coefficients (rs) and adjusted P values (Padj) are shown. The shaded area represents the 95% CI. Clinical parameters include COHb, TM, lymphocyte count (lym), neutrophil count (neu), NLR, PaO2:FiO2 ratio and CRP.
BALF virus-specific T cells are linked to improved outcomesTo investigate factors influencing airway T cell responses, we stratified samples based on vaccination history, disease severity, sampling time after symptom onset, and viral RNA shedding. Unlike peripheral T cells17,18,19, airway virus-specific T cell frequencies showed no significant differences between BIs and NIs when analyzed at similar time points (Fig. 2h,i). Furthermore, no correlation was observed between T cell responses and the number of vaccine doses received, suggesting that prior intramuscular COVID-19 vaccination had limited impact on mucosal T cell responses (Fig. 2k,l). Although airway SARS-CoV-2-specific T cell levels tended to be higher in severe cases later in the disease course (>2 weeks post symptom onset (wpo)), this did not reach statistical significance (Fig. 2h,i).
Moreover, a strong positive association was observed between airway-specific CD8+ and CD4+ T cells (Fig. 2j), indicating a potential synergistic relationship. Neither CD8+ nor CD4+ T cell responses were associated with neutralizing antibody levels in BALF or the age of patients in this cohort (Fig. 2k,l). To examine the functional role of airway virus-specific T cells, we correlated their frequencies with viral loads and respiratory function. Enhanced T cell responses were associated with lower viral gene copies, suggesting a role in viral clearance (Fig. 2k,l). Moreover, higher frequencies of specific CD8+ T cells in BALF correlated with improved oxygenation (PaO2:FiO2 ratio), oxygen delivery, and blood pH levels, indicating a beneficial effect on respiratory function (Fig. 2l). These T cells were also inversely correlated with systemic inflammatory markers (C-reactive protein (CRP), interleukin-8 (IL-8), interleukin-6 (IL-6)), and corticosteroid use (Fig. 2l). In contrast, higher specific CD4+ T cell levels in BALF were associated with markers of severe disease, such as elevated carboxyhemoglobin (COHb), thrombomodulin (TM), neutrophilia, lymphopenia, and higher neutrophil:lymphocyte ratios (NLRs) (Fig. 2k), indicating a distinct functional role compared to CD8+ T cells.
Enhanced activation and functionality of BALF-specific T cellsIn addition to the higher frequencies, specific T cells in BALF exhibited higher levels of IFNγ and tumor necrosis factor (TNF) compared to PBMCs (Fig. 3a), thus reflecting stronger activation. We further characterized these T cells using a 29-color flow cytometry panel, assessing viability, surface markers, intracellular cytokines, chemokine receptors and immune checkpoint molecules. Virus-specific T cells in BALF exhibited superior multi-cytokine production, with polyfunctionality increasing over the course of the disease (Fig. 3b). Correlation analyses showed a positive association between disease duration and polyfunctional specific T cells in BALF, but not in PBMCs (Fig. 3c), highlighting the dynamic nature of T cell functionality in the lungs.
Fig. 3: Activated and polyfunctional phenotypes of specific T cells in the BALF of patients with COVID-19.
a, Summary plots comparing the mean fluorescence intensity (MFI) of IFNγ and TNF in the IFNγ+CD4+ and IFNγ+CD8+ T cells between 18 paired BALF and PBMC samples from 15 patients. A two-tailed Wilcoxon matched-pairs signed-rank test was used. b, Multi-cytokine expression of specific T cells was assessed using flow cytometry after SARS-CoV-2 peptide stimulation. Each 10 × 10 dot plot represents the coexpression of multiple cytokines in a representative sample, with the dots indicating 1% of cells and the colors reflecting cytokine profiles (legend below). Cumulative cytokine patterns from 18 paired BALF and PBMC samples of 15 patients are shown as pie charts, color-coded using the number of cytokines expressed: gray (IFNγ), orange (two cytokines), green (three cytokines), pink (four cytokines) and purple (five cytokines). Analysis was performed using a mixed model fit by REML, with Šídák’s multiple comparisons test. c, Polyfunctional specific T cells, producing more than one cytokine, were analyzed for their correlation with the sampling time points (dpo). Two-tailed Spearman correlation results are shown, with sample and patient numbers indicated (ns/np). d,e, TriMap projections of specific (IFNγ+) T cells in BALF (n = 10) and PBMC (n = 11) (d), grouped into nine clusters based on FlowSOM clustering (e). The analysis included ten paired BALF and PBMC samples, plus an additional PBMC sample, from eight patients. Cluster characteristics are displayed alongside the map, and cluster distributions and proportions are shown below (e, see also Extended Data Fig. 2a). f, TriMap projection showing the distribution of the indicated proteins. g, Heatmap of z-scores calculated per marker, based on the MFI of protein expression on specific CD4+ and CD8+ T cells in BALF (n = 10) and PBMC (n = 11) samples. h, Memory phenotypes of specific T cells in BALF (n = 23) and PBMCs (n = 22) were summarized based on CD45RA and CCR7 expression: TN cells (CD45RA+CCR7+), TCM cells (CD45RA−CCR7+), TEM cells (CD45RA−CCR7−) and TEM cells re-expressing CD45RA, CD45RA+CCR7− (TEMRA). Data are presented as the mean ± s.e.m. GM-CSF, granulocyte-macrophage colony-stimulating factor. max., maximum; min., minimum.
Dimensionality reduction analysis of paired BALF and PBMC samples revealed distinct segregation between the two compartments (Fig. 3d), identifying nine T cell clusters (Fig. 3e). Notably, clusters enriched in BALF included C1 (CD103+CD8+ tissue-resident TM cells (TRM)), C5 (CXCR3hiCCR5hiCD4+ T cells), C6 (PD-1+CD4+ T cells) and C7 (polyfunctional CD4+ T cells), while PBMCs were enriched in less activated subsets (IFNγlo) (Fig. 3e and Extended Data Fig. 2a). These T cells in BALF displayed potent cytokine production (IFNγ, TNF), activation markers (CD69, HLA-DR) and tissue-resident markers (CD103, CCR5), while displaying lower levels of immune inhibitory molecules (T cell immunoglobulin and mucin domain-containing protein 3 (TIM-3), PD-1) (Fig. 3f,g). Memory subset analysis showed that virus-specific T cells in BALF, along with the total T cell population, were predominantly effector memory T (TEM) cells (CCR7−CD45RA−), in contrast to the memory profiles seen in PBMCs (Fig. 3h and Extended Data Fig. 2b,c). These findings suggest that airway virus-specific T cells possess enhanced activation, broad functionality and a tissue-resident phenotype, probably driven by the antigen-rich inflammatory lung environment. This hypothesis is further supported by elevated levels of IFNs (IFNα, IFNγ), pro-inflammatory cytokines (IL-1β, IL-6, TNF, granulocyte colony-stimulating factor), chemokines (CCL2, CXCL8, CCL3) and T cell-related cytokines (interleukin-2 (IL-2)) in BALF compared to plasma (Extended Data Fig. 2d).
Heightened clonal expansion of BALF-specific T cellsWhile the transcriptomic landscape of total T cells in the BALF of patients with COVID-19 has been characterized2, the features of SARS-CoV-2-specific T cells in this compartment are poorly understood. To map the transcriptional profile of virus-specific T cells in BALF, we performed single-cell RNA sequencing (scRNA-seq) and single-cell TCR sequencing (scTCR-seq) on 16 paired BALF and PBMC samples from 13 patients, generating a dataset of 186,451 cells (Fig. 4a and Extended Data Fig. 3a,b). This dataset included epithelial cells, tissue-resident AMs (TRAMs), monocyte-derived macrophages, monocytes, dendritic cells (DCs), B cells, T cells, plasma cells, natural killer (NK) cells and NKT cells. Consistent with previous studies20,21,22, the cellular distribution in BALF differed substantially from that in the peripheral blood. We identified 12,093 T cells in BALF, distributed across 5,290 unique clones, compared to 22,750 T cells in PBMCs, corresponding to 10,236 distinct clones (Fig. 4b). Notably, 300 clonotypes were shared between the two compartments, indicating a degree of clonal overlap (Fig. 4b).
Fig. 4: Clonality and diversity of the specific T cell repertoire in BALF and PBMCs.
a, Experimental workflow for single-cell analysis (Chromium 5′ scRNA-seq and scTCR-seq) and identification of SARS-CoV-2-specific T cells. Briefly, 16 paired BALF and PBMC samples from 13 patients were subjected to single-cell sequencing. The remaining cells from these PBMC samples were labeled with CTV and cultured ex vivo under stimulation with SARS-CoV-2 peptide pools; the proliferated short-term T cell lines (CTVlo population) were sorted for subsequent bulk TCR-seq, identifying specific TCRs. scTCR-seq sequences were then aligned with the bulk TCR sequences to identify antigen-specific T cells and obtain their single-cell transcriptomic profiles. A cell was defined as antigen-specific if both its TRAV and TRBV sequences matched those in the specific TCR repertoire. b,c, Venn diagrams illustrating the number of overlapping and unique TCR clones, along with the corresponding total T cell (b) and SARS-CoV-2-specific T cell (c) counts between BALF and PBMC. d,e, Comprehensive summary of T cell clonality based on tissue (BALF and PBMC) (d) and cell types (CD4+ and CD8+ T cells) (e). f, Summary of specific T cell clonality. g, Abundance and diversity of specific T cell repertoire in BALF and PBMCs. Comparison of the Hill diversity index (qD, y-axis) over varying diversity orders (q, x-axis) was shown. The shaded area represents the 95% CI. h, Distribution of specific T cell clones among the top 200 ranked T cell clones in the entire T cell repertoire from BALF and PBMCs. The red rectangles indicate specific T cell clones and the gray ones stand for undefined clones. i, Upset plots illustrating the TRBV clonotypes shared among virus-specific and total T cells identified from single-cell sequencing data in the BALF and PBMC samples, along with published SARS-CoV-2-specific TCR sequences. Colored dots connected by lines represent shared clonotypes. The horizontal bar graph shows the total number of TCR clonotypes for each cluster intersection, while the vertical bar graph indicates the number of clonotypes shared across overlapping clusters.
To identify SARS-CoV-2-specific T cells, autologous PBMCs were labeled with Cell Trace Violet (CTV), stimulated with a SARS-CoV-2 peptide pool and cultured ex vivo. After 12 days, proliferated antigen-specific T cells (CTVlo) were sorted and subjected to bulk TCR-seq (Fig. 4a and Extended Data Fig. 4a)23. TCR sequences from scRNA-seq were matched to these TCR sequences to identify virus-specific T cells. A T cell clone was classified as SARS-CoV-2-specific if its TCR alpha and beta chains matched 100% with the bulk TCR sequences; otherwise, it was considered undefined (Fig. 4a). Under these criteria, we identified 430 specific T cell clones in BALF and 333 in PBMCs, including 1,188 and 690 specific T cells, respectively (Fig. 4c). Of these, 49 clones were shared between BALF and PBMCs (Fig. 4c). The proportion of specific T cells identified using this approach showed strong concordance with those identified using the ICS assay (Extended Data Fig. 4b). BALF T cells displayed greater clonal expansion (defined as a clone size >1) compared to those in PBMCs, with CD8+ T cells showing more pronounced expansion than CD4+ T cells (Fig. 4d,e). Moreover, the proportion of clonally expanded specific CD4+ and CD8+ T cells was remarkably higher in BALF (Fig. 4f), with reduced TCR diversity, indicating clonal focusing (Fig. 4g and Extended Data Fig. 4c). Notably, virus-specific T cells were predominantly represented in the top 200 most expanded clones (Fig. 4h). Longitudinal analysis of patient PT1 showed that virus-specific T cell clones were among the top 100 clones across all BALF samples (Extended Data Fig. 4d).
To further validate these findings, we cross-referenced the identified TCR sequences with public SARS-CoV-2-specific TCR repertoires from the Immune Epitope Database (IEDB)24,25. As most published TCR sequences are derived from single-chain data, we used 9,978 TRBV sequences for CD4+ and 133,118 for CD8+ T cells for alignment. In BALF, 25 CD4+ and 31 CD8+ T cell clones shared TRBV sequences with the public repertoire, while 19 CD4+ and 33 CD8+ clones in PBMCs (Fig. 4i). This confirms that aligning single-cell TCR sequences with autologous short-term T cell line sequences enhances SARS-CoV-2-specific T cell identification.
Activated antiviral transcriptome of BALF-specific T cellsUnsupervised clustering of CD4+ and CD8+ T cells in the transcriptomic dataset (Extended Data Fig. 3) revealed 12 distinct clusters (Fig. 5a), distributed across BALF and PBMCs (Fig. 5b). These clusters were annotated as cytotoxic (C0; NKG7, GZMB, GZMH, GNLY, PRF1, CCL4 and CCL5), type I IFN response (C7; IFIH1 and IFIT1–IFIT3), cycling (C6; CENPU, MCM4 and MKI67), regulatory T (Treg) cells (C8; CTLA4, FOXP3 and IL2RA), naive T (TN) cells (C1 and C9; EEF1B2, EEF1G, RPS3A and RPL22), central memory T (TCM) cells (C5 and C10; CCR7, LEF1, IL7R and TCF7) and TRM cells (C3 and C4; ZEB2, ITGA1, ITGAE, RBPJ and CXCR6) (Fig. 5a–d). BALF-specific T cells were predominantly CXCR3+CD4+ TEM cells (C2), RBPJ+CD4+ TEM/TRM cells (C4) and NKG7+CD8+ TEM cells (C0), ITGA1+CD8 TEM/TRM cells (C3) and proliferative T cells (C6), with higher expression of effector and antiviral genes compared to PBMCs (Fig. 5e–g). Gene set enrichment analysis (GSEA) identified significant enrichment of pathways related to IFNγ response, T cell activation, inflammation, tissue migration, proliferation and metabolism in BALF virus-specific T cells (Fig. 5h).
Fig. 5: Transcriptional features of specific T cells in BALF and PBMCs.
a, Uniform manifold approximation and projection (UMAP) plot displaying the transcriptomic clusters of all T cells from the 16 paired BALF and PBMC samples from 13 patients. b, Distribution of clusters in BALF (red) and PBMCs (blue). c, Summary of cluster proportions on T cells in BALF and PBMCs. d, Average expression (color scale) and percentage of expressing cells (size scale) of selected genes across the indicated clusters of total T cells. e, Distribution of specific T cells (red dots) in BALF (left) and PBMCs (right). f, Summary of cluster proportions of specific T cells in BALF and PBMCs. g, Volcano plots showing differentially expressed genes (DEGs) in specific CD4+ and CD8+ T cells between BALF and PBMCs. The names of the indicated DEGs are shown. Horizontal black dashed line: Benjamini–Hochberg Padj = 0.05. h, Enriched immune pathways in specific T cells in BALF versus PBMCs were identified based on the normalized enrichment score (NES), with statistical significance defined as P < 0.05 after Benjamini–Hochberg correction. The count denotes the pathway size reflecting the number of genes detected in the expression dataset. i, Dot plots illustrating key genes in the indicated functional modules of specific T cells in BALF and PBMCs. j, Two-tailed Spearman correlation analysis between the indicated genes expressed in specific CD4+ (pink) and CD8+ (aqua) T cells in BALF.
Functional gene modules highlighted higher expression of core genes linked to activation (HLA-DRB5, ICOS), proliferation (CENPM), survival (BCL2), cytokine (IFNG, CCL5), cytotoxicity (GZMB, PRF1), tissue residency (RBPJ, ITGA1, ZNF683), TCR signaling pathways (LCP2, JUN) and anti-ferroptosis (GPX4) markers in BALF-specific T cells, while peripheral markers and genes related to apoptosis (CASP3), pyroptosis (NLRP3), peripheral circulation (CCR7, S1PR1), terminal differentiation (KLRG1) and oxidative phosphorylation (MT-CO3, COX7C) genes were downregulated (Fig. 5i). Metabolic analysis revealed a shift toward mammalian target of rapamycin (mTOR) signaling (SLC7A5, CFL1), glycolysis (TPI1, LDHA), fatty acid metabolism (FABP5) and amino acid metabolism (SLC3A2) in BALF-specific T cells (Fig. 5i), reflecting a robust response to viral infection26. These results suggest hyperactivation of T cells rather than exhaustion, as indicated by positive correlations between activation, cytokine production, cytotoxicity and mTOR signaling (Fig. 5j and Extended Data Fig. 5a,b).
Further comparison of T cells bearing identical TCRs in BALF and PBMCs revealed that 49 overlapping virus-specific clones were distributed across distinct clusters in each compartment (Fig. 6a). In BALF, these clones were predominantly found in clusters C0, C2, C3, C4 and C6; in PBMCs, they appeared in clusters C0, C2, C3 and C6 (Fig. 6b). Notably, the dominant clones in BALF did not consistently align with the largest clones in PBMCs (Fig. 6c), suggesting a potential difference in TCR usage between airway and peripheral compartments. Additionally, shared clones in the airway, but not in the periphery, exhibited significantly higher expression of genes linked to a metabolically active and highly proliferative state (Fig. 6d).
Fig. 6: Comparison of overlapping specific T cell clones in BALF and PBMCs.
a, Distribution of specific T cell clones (cl.) overlapping between BALF and PBMCs, mapped onto T cell clusters colored according to the indicated clones. b, Pie charts summarizing the cumulative cluster proportions of specific T cells covering the 49 overlapped T cell clones, with T cell clustering corresponding to Fig. 5a. c, Variation in clone size for each clone from BALF and PBMCs, with clones colored as in a. d, Comparison of expression levels of selected genes in the 49 overlapped T cell clones between BALF (red) and PBMCs (blue). Each dot represents one T cell clone, with consistent clones connected by a gray line. The box plots depict the median and IQRs, with the whiskers extending to 1.5× the IQR or maximum value (two-tailed pairwise Wilcoxon rank-sum tests with Benjamini–Hochberg correction).
Smart-seq2 analysis of epitope-specific T cells in BALFTo extend our findings, we performed targeted analysis on CD8+ T cells specific for the B40/N322 (MEVTPSGTWL) epitope in four paired BALF and PBMC samples from four patients (PT6, PT17, PT18 and PT19) bearing the HLA-B*40:01 alleles. In line with previous findings (Fig. 2b), the frequency of B40/N322-specific CD8+ T cells was significantly higher in BALF compared to PBMCs (Extended Data Fig. 5c,d). Smart-seq2 transcriptional profiling showed elevated expression of genes linked to cytotoxicity (FASLG), chemotaxis (CCL3), tissue residency (ITGA1) and cell survival (PHLDA1) in BALF compared to PBMCs (Extended Data Fig. 5e). GSEA further confirmed pathway enrichment involved in T cell activation, chemotaxis, proliferation and cytotoxicity in BALF (Extended Data Fig. 5f). These B40/N322-specific CD8+ T cells mirrored the transcriptional characteristics of the broader antigen-specific T cell population, highlighting a highly activated, potent local T cell response distinct from that observed in PBMCs.
Enhanced BALF- specific T cell function after viral clearanceThe important role of antigen-specific T cells in the lung has been well established in animal models27,28. Our results revealed a negative correlation between the abundance of virus-specific T cells in BALF and viral loads (Fig. 2k,l), highlighting their potential role in viral clearance. In samples collected after viral clearance (RNA−), the frequency of specific T cells was significantly higher compared to those collected before viral clearance (RNA+), particularly during the 14–28 dpo window, where sample numbers in the two groups were comparable (Fig. 7a,b). This increase was accompanied by the expansion of specific T cell clones in BALF (Fig. 7c). Notably, not all T cell clones showed uniform contraction from RNA+ to RNA− stages. Longitudinal tracking of persistent clones in PT1 revealed shifts in dominant clonal populations after viral clearance in BALF (Fig. 7d) and PBMCs (Extended Data Fig. 6a). These clonal dynamics suggest that differences in affinity, survival signaling and adaptation to the local antigen environment could drive variability among clones. Additionally, gene expression profiling of BALF-specific T cells showed significantly elevated expression of IFNG, CD69 and RGCC, alongside reduced expression of IFI16, IFITM2 and MT-CO3 after viral clearance, whereas those in PBMCs displayed minimal changes (Fig. 7e and Extended Data Fig. 6b). These findings underscore a tight relationship between local viral elimination and the activity of airway-specific T cells.
Fig. 7: Potently activated specific T cells contribute to viral clearance.
a,b, Kinetics (a) and summary (b) of specific T cells in BALF over the sampling time (dpo) during viral shedding (RNA+, red, ns/np: 61/60) and after viral clearance (RNA−, blue, ns/np: 52/51). Data are presented as the mean ± s.e.m., with the number of samples (ns) and patients (np) indicated. Statistical comparisons were performed using a linear mixed-effects model fit by REML, with two-tailed t-tests based on Satterthwaite’s method. c, Clonality analysis of specific T cells in BALF at the RNA+ (n = 8) and RNA− (n = 8) stages. d, Distribution (left) and clone size (right) of persistent specific T cell clones from RNA+ to RNA− stages in the BALF samples. e, Volcano plot of DEGs in specific CD4+ and CD8+ T cells in BALF comparing the RNA+ and RNA− stages. Horizontal black dashed line: Benjamini–Hochberg Padj = 0.05. f, GSEA analysis of specific CD4+ (top) and CD8+ (bottom) T cells in BALF comparing RNA+ (n = 8) versus RNA− (n = 8) stages. g, Comparison of immune function-associated scoring modules between specific T cells during the RNA+ (n = 8) and RNA− (n = 8) stages. The scoring methods are detailed in the Methods. Data are presented as the mean ± s.d.; a two-tailed Mann–Whitney U-test was used. h, Proportion of cell subclusters (clustered in Extended Data Fig. 3a) in BALF during the RNA+ and RNA− stages. i, Proportion of the AM population in leukocytes (CD45+) in BALF samples between the RNA+ (n = 56) and RNA− (n = 50) stages based on flow data. Each dot represents one sample. Data are shown as the mean ± s.e.m.; a two-tailed Mann–Whitney U-test was used. j, Circos plot depicting prioritized ligand–receptor interactions between T cells and other cell types in BALF. The outer ring shows the color-coded cell types, while the inner ring highlights the ligand–receptor pairs. The line and arrow widths are proportional to the log fold change between the RNA− and RNA+ progression stages in ligands and receptors, respectively. Different colors and line types denote several types of interactions, as outlined in the legend. FDR, false discovery rate.
GSEA and functional module analysis of BALF virus-specific T cells after viral clearance revealed enrichment in pathways related to activation, cytokine production and tissue migration, with a reduction in type I IFN responses (Fig. 7f,g). These functional shifts in BALF-specific T cells from RNA+ to RNA− were consistently observed in longitudinal samples from patient PT1 (Extended Data Fig. 6c–f). Additionally, immune cell subset distribution shifted after viral clearance characterized by a decrease in inflammatory monocytes (CD14+ monocyte and monocyte-derived AM subpopulations) and plasma cells, alongside an increase in TRAM cells, the predominant immune cells in the BALF of healthy donors29 (Fig. 7h). Flow cytometry corroborated this finding, revealing an increase in alveolar macrophage numbers (Fig. 7i). Ligand–receptor interaction analysis suggested reduced T cell interactions with alveolar cells, indicating a regulated immune environment after clearance (Fig. 7j). Consistently, inflammatory cytokine levels tended to reduce, albeit not significantly in BALF after clearance (Extended Data Fig. 6g).
Post-clearance TRM differentiation of BALF-specific T cellsCluster analysis of BALF virus-specific T cells revealed a substantial increase in CXCR3+CD4+ TEM cells (C2) and ITGA1+CD8+ TEM/TRM cells (C3), coupled with a reduction in proliferating T cells (C6) after viral clearance (Fig. 8a). Pseudotime trajectory analysis30 indicated three distinct differentiation pathways for specific CD4+ T cells: early CD4+ TEM (C1, C2) cells were linked to proliferating T cells (C6), which then diverged into TRM-driven (C4) and TH1-polarized TEM (C2) cell lineages (Fig. 8b). Similarly, specific CD8+ T cells followed a more linear trajectory from cytotoxic CD8+ TEM (C0) to proliferative T cells (C6) and then to TRM-like CD8+ cells (C3) (Fig. 8c). Notably, these pseudotime trajectories were predominantly observed in BALF virus-specific T cells, but not in PBMCs, underscoring the localized tissue-specific differentiation occurring in lungs during viral clearance (Fig. 8d,e). Marker gene profiling along these trajectories—covering key genes involved in tissue migration (CXCR3), proliferation (MKI67, CENPF), cytokines (GZMB, TNF, CCL4, CCL5), tissue residency (ITGAE, ITGA1, ZEB2) and survival (BCL2, IL7R)—confirmed the functional specialization of these clusters (Fig. 8f,g). Density plots illustrating the distribution of T cells in these dominant subclusters across RNA+ and RNA− phases further supported these observations, revealing a shift from highly proliferative TEM to TH1-polarized TEM and TRM cells in BALF, but not in PBMCs (Fig. 8h,i and Extended Data Fig. 6h).
Fig. 8: Antigen-specific T cells in BALF exhibit a differentiation bias toward multifunctional TRM cells after viral clearance.
Comments (0)