Ethics and approvals
All experimental procedures were conducted in agreement with guidelines for work with laboratory animals described by the European Union (directive 2010/63/EU) and the Norwegian Animal Welfare Act of 1974/2010 (replaced by the new Animal Welfare Act in 2010). Experiments were approved by the National Animal Research Authority of Norway (Mattilsynet). Experiments followed the principles of humane experimental techniques, to Replace, Reduce and Refine.
Animals
The ACANflx/PVcre mice were obtained by crossing homozygous ACAN-flox (ACANflox+/+) mice with homozygous PVcre mice (PVcre+/+). From this first round of breeding, all mice had an ACANflx+/-/PVcre+/− genotype and went through another cross to obtain the homozygous genotype. Only one copy of the Cre allele is necessary for recombination. Therefore, from the second-generation litters, we used both ACANflx+/+/PVcre+/+ and ACANflx+/+/PVcre+/−. Animals were bred locally in the animal facility at Dept. of Comparative Medicine at the University of Oslo. PVcre mice (+/− and +/+) were used as controls. ACANflx+/+ were included in the experiments on visual cortex plasticity. The animals were between three and six months at the time of experiments and housed in individually ventilated cages (IVC, GM500, Scanbur) with a 12 h light/dark cycle. Behavioral experiments were conducted in the dark phase.
Extracellular recording using silicon probes
Surgery was performed under isoflurane anesthesia (5% induction, 1–2% maintenance) using a SomnoSuite vaporizer (Kent Scientific). The animal was given a local subcutaneous injection of Bupivacaine adrenalin (Marcain 0.5%, 1 mg/kg) in the scalp and a subcutaneous injection of Buprenorphine (Temgesic, 0.05 mg/kg) before the start of the surgery. The animal was secured in a stereotaxic surgical frame using ear bars placed anterior to the ear canal. The eyes were covered with Viscotears (2 mg/g, Vitus Apotek) to prevent dehydration. A small patch of skin was removed to expose the skull, and the skull was lightly scored using a surgical blade. A small hole was drilled into the skull using a hand-held Perfecta-300 dental drill (W & H Nordic) to fit in a screw used as a ground reference during the electrophysiological recording. A custom head-bar was glued to the skull using Vetbond (3 M, VWR), and secured using C&B SuperBond dental acrylic (Parkell). The animal was given a subcutaneous injection of Norodyl (carprofen, 5 mg/kg) and placed in a cage to recover. Norodyl was given for three consecutive days after surgery.
Animals were habituated to the running wheel and trained to run voluntarily for two days prior to the extracellular recording experiment. On the day of the first recording session, a large craniotomy was made over the primary visual cortex (V1) centered at 3.1 mm laterally from lambda. Following the craniotomy, the exposed brain was covered with gel foam soaked in sterile saline solution, the animal was transferred to the experimental setup and allowed to recover from the brief anesthesia. A silicone probe (NeuroNexus A1 × 32-5mm-25-177) was attached to a stereotaxic frame and slowly lowered ~800–900 µm into V1. Before the recordings started, the probe was left in the tissue for a minimum of 30 min to let the tissue recover [60].
Animals were tested for ocular dominance plasticity by using monocular deprivation (MD). Immediately after the first round of extracellular recordings, or if the animals were only used for “after MD” recordings, a drop of Alcaine was administered to the contralateral eye before it was sutured close. After 4 days, extracellular activity was recorded shortly after removing eyelid sutures. If it was the last recording session, the probe was coated with a fluorescent dye (Sigma-Aldrich 42364) for post-mortem histological verification, and the animal was transcardially perfused as described below.
The 32-channel silicone probe was connected to an Intan RHD 2132 amplifier board (hardware bandpass filtering between 1.1 Hz and 7.5 kHz) which was connected to an Open Ephys acquisition system [61] via a thin SPI cable (Intan Technologies, USA). Data was sampled at 30 kHz and saved to disk for offline analysis. We used Expipe [62] to manage all data which were then saved to Exdir format [63] for further processing. All data were low-pass filtered at 300 Hz, processed with a notch filter to remove 50 Hz line noise (quality factor Q = 100, scipy.signal.iirnotch function), resampled at 1 kHz, and z-scored according to channel. Visual stimulus periods were extracted and aligned according to stimulus onset for the LFP trace and frequency spectrum. To investigate the LFP oscillations for the different frequency bands during spontaneous and stimulus evoked LFP activity, we computed the spectrogram of the z-scored LFP signals with continuous wavelet transform applied using a Morlet wavelet [64]. The median power spectral density was then extracted for 200 ms before and 200 ms after stimulus onset.
Visual stimulation
Visual stimuli was generated using custom scripts written in Psychopy [65] and presented on a computer monitor placed 25 cm in front of the mouse, spanning 30° degrees of the horizontal visual field. Stimuli consisted of full-field drifting sinusoidal gratings of 100% contrast, with a temporal frequency of 2 Hz and spatial frequency of 0.04 cycles/degree. The gratings were presented at eight orientations (separated by 45°) for 2 s each, followed by 1 s of mean-luminance gray. Trials were randomized, and eight repetitions of each orientation were used per electrophysiological recording with gratings.
AAV construct cloning and packaging
For patch-clamp electrophysiology experiments, mice (p35-70) were injected intravenously, in the retro-orbital sinus, with a systemic PHP.eB AAV expressing flex-tdTomato, to label PV+ cells. For adult KO of ACAN in PV+ cells, ACANflx mice were injected retro-orbitally with a PV enhancer Cre-P2A-mGreenLantern or GFP virus. The AAVs were produced as described in a protocol by Challis et al. (Challis et al., 2019). Briefly, AAV HEK293T cells (Agilent) were cultured in DMEM with 4.5 g/L glucose & L-Glutamine (Lonza), 10% FBS (Sigma) and 1% PenStrep (Sigma), in a 37 °C humidified incubator. The cells were thawed fresh and split at ~80% confluence until four 182.5 cm2 flasks were obtained for each viral prep. The cells were transfected at 80% confluence and the media was exchanged for fresh media directly before transfection. The cells were triple transfected with the desired construct, dF6 helper plasmid and PHP.eB serotype plasmid. Polyethylenimine (PEI), linear, molecular weight (MW) 25,000 (Polysciences, cat. no. 23966-1) was used as the transfection reagent. Media was harvested three days after transfection and kept at 4 °C, and media with cells was harvested five days after transfection and combined with the first media harvest. After 30 min centrifugation at 4000 × g, the cell pellet was incubated with SAN enzyme (Arctic enzymes) for 1 h. The supernatant was mixed 1:5 with PEG and incubated for 2 h on ice, then centrifuged at 4000 × g for 30 min to obtain a PEG pellet containing the virus. The PEG pellet was dissolved in SAN buffer and combined with the SAN cell pellet for incubation at 37 °C for 30 min. To purify the AAV particles, the suspension was centrifuged at 3000 × g for 15 min. The supernatant was loaded on the top layer of an Optiseal tube with gradients consisting of 15, 25, 40 and 60% iodixanol (Optiprep). Ultracentrifugation was performed for 2.5 h at 18 °C at 350,000 × g in a type 70 Ti rotor (Beckman Coulter). The interface between the 60 and 40% gradient was extracted along with the 40% layer, avoiding the protein layer on top of the 40% layer. The viral solution was filtered through a Millex- 33 mm PES filter and transferred to an Amicon Ultra-15 centrifugal filter device (100-kDa molecular weight cutoff, Millipore) for buffer exchange. A total of four washes with 13 ml DPBS were performed at 3000 × g before concentration to a volume of ~500–750 µL. Viral solutions were sterilized using a 13 mm PES syringe filter 0.2 μm (Nalgene), and stored in sterile, low-bind screw-cap vials at 4 °C.
Viral titers were determined using qPCR with primers targeting AAV2 ITR sites. Briefly, 5 µL of viral sample was added to 39 µL ultrapure H2O, 5 µL 10× DNase buffer, 1 µL DNase, and incubated at 37 °C for 30 min to eliminate all DNA not packaged into AAV capsids. 5 µL of the DNase-treated sample was added to a reaction mix consisting of 10 µL 2× SYBR master mix, 0.15 µL of each primer (100 µM) and 4.7 µL nuclease free H2O. Cycling conditions for the qPCR program were: 98 °C 3 min/98 °C 15 s/58 °C 30 s/read plate/ repeat 39× from step 3/melt curve.
The PHP.eB serotype plasmid, pUCmini-iCAP-PHP.eB was a gift from Viviana Gradinaru (http://n2t.net/addgene:103005;RRID:Addgene_103005). The DeltaF6 helper plasmid, pAdDeltaF6 was a gift from James M. Wilson (http://n2t.net/addgene:112867;RRID:Addgene_112867). pAAV-FLEX-tdTomato was a gift from Edward Boyden (Addgene plasmid # 28306, RRID:Addgene_28306). PV:mGreenLantern-P2A-NLS-CRE was cloned via multiple intermediate plasmids, is available upon request, and will be deposited at Addgene.
AAVs were injected intravenously in the retro-orbital sinus. Briefly, each mouse was anesthetized in 5% isoflurane and injected retro-orbitally with 5 × 10¹² vector genomes of AAV. A drop of Alcaine was administered to the eye post-injection, and the mice were left to recover from anesthesia in a heated chamber for a few minutes.
Acute slice preparation
Acute slices were prepared from mice aged 70–140 days according to the protective recovery method described by Ting et al. [66]. Mice were anesthetized in 5% isoflurane and injected intraperitoneally with a lethal dose of pentobarbital. When breathing had slowed and the animal no longer responded to strong toe or tail pinching the mouse was transcardially perfused with freshly bubbled, chilled NMDG-ACSF, containing the following in mM: 93 NMDG, ~93HCl, 2.5 KCl, 1.2 NaH2PO4, 30 NaHCO3, 20 HEPES, 25 glucose, 5 sodium ascorbate, 2 thiourea, 3 sodium pyruvate, 10 MgSO4·7H2O, 0.5 CaCl2·2H2O. The brain was dissected and mounted on a Leica vt1200s vibratome in a continuously cooled and bubbled chamber. Coronal sections (300 µm) were cut in a caudal to rostral direction until V1 was no longer visible. Slices were left to recover for 25 min in heated NMDG-ACSF while sodium was gradually reintroduced. Following recovery slices were moved to a high HEPES holding ACSF containing the following in mM: 92 NaCl, 2.5 KCl, 1.2 NaH2PO4, 30 NaHCO3, 20 HEPES, 25 glucose, 5 sodium ascorbate, 2 thiourea, 3 sodium pyruvate, 2 MgSO4·7H2O, 2 CaCl2·2H2O, at room temperature. The slices were incubated in the recovery chamber for at least one hour before transfer to the recording chamber. All solutions were continuously bubbled with 95% O2, 5% CO2.
Patch-clamp
Whole-cell patch-clamp recordings were performed in V1. Cells were visualized on a Zeiss axioscope using infrared DIC illumination and a hamamatsu c2400 CCD camera. The PV+ cells were identified by the virally expressed, red fluorescent tdTomato. The recording chamber was continuously perfused at a rate of 4 ml/min with continuously carbogen-bubbled recording ACSF of the following composition in mM: 124 NaCl, 2.5 KCl, 1.2 NaH2PO4, 24 NaHCO3, 5 HEPES, 12.5 Glucose, 2 MgSO4.7H20, 2 CaCl2.2H20. pH was adjusted to 7.3–7.4, and osmolarity to 305-310 mOsm. Pipettes were pulled from thick-walled borosilicate glass capillary tubes to a tip resistance of 3.5–4.9 MΩ. For current clamp experiments in Fig. 3, pipettes were filled with an intracellular solution containing the following, in mM: 120 K-Gluconate, 20 KCl, 10 EGTA, 10 HEPES, 2 MgCl2, 2 Na2ATP (Hu et al., [9]). pH was adjusted to 7.3 using KOH, and osmolarity to ~295 mOsm. For current and voltage clamp experiments in Figs. 7, S2 and S3, a low-chloride IC solution was used for simultaneous measurement of sEPSCs and sIPSCs: 140 K-gluconate, 2 KCl, 5 EGTA, 10 HEPES, 4 Mg-ATP, 0.5 Na-GTP, 5 creatine phosphate [67]. Signal was amplified and low-pass filtered on a Multiclamp 700b amplifier (Molecular devices; 6 kHz), and digitized on a Digidata 1550B digitizer at 100 kHz (Molecular devices) using the pClamp11 software package (Molecular Devices).
Membrane potential was measured immediately upon establishment of the whole-cell configuration in I = 0 mode. Cells with access resistance (Ra) greater than 25 MΩ were discarded. Maximum firing rate and FI curves were established from a 1 s step current stimulus, starting at -100pA and increasing by 50pA per sweep. The start of each sweep featured a 500 ms hyperpolarizing stimulus, from which the input resistance (Ri), time constant (τ) and capacitance (Cm) was measured.
Current clamp recordings were analyzed using the pyABF module [68] for ABF file handling and visualization, and the eFEL module [69] for feature detection in custom python 3.6 scripts (available upon request). Input resistance was calculated from the voltage deflection of a hyperpolarizing current step. The membrane time constant (τ) was calculated from an exponential decay fit to the same hyperpolarizing current step. Capacitance (Cm) was calculated from the slowest time constant and the input resistance [70]. For establishing the FI curve and the maximum firing rate, eFEL was used to count action potentials during the 1 s stimulus using a derivative threshold of 15 and an interpolation step of 0.01. Action potential detection was plotted and visually verified for at least the fastest spiking trace in each experiment. sEPSCs and sIPSCs were detected and analyzed from 300 s (Fig. 7) or 75 s (Fig. S3) gap free recordings using template matching in Easy Electrophysiology, and custom python scripts (available upon request).
For in vivo chABC treatment of ACANflx/Pvcre mice (Fig. 7), surgery was performed as described above, three days prior to acute slice preparation. 500 nanoliters of 60U/ml chABC (AMSBIO) was injected unilaterally in V1 using a Nanoject III (Drummond). The opposite hemisphere served as an untreated control.
For acute chABC treatment (Figs. S2, S3), initial recordings (time 0) were acquired 15 min after whole cell configuration was achieved. chABC (Sigma or AMSBIO) was dissolved in 10 ml of freshly bubbled ACSF, for a concentration of 1U/ml. Following CC and VC recording at time 0, the recording solution was replaced with continuously bubbled chABC ACSF. Additional recordings were acquired at various time points, including 50 min.
Morris water maze
The pool used was 120 cm in diameter, with 30 cm from the edge of the pool to the platform and with a platform diameter of 11 cm. For analysis and training purposes, the pool was divided into four equal quadrants. The pool was filled with water holding a temperature 13 degrees below body temperature (~23 degrees). The water was made opaque using water-based white paint (Ready mix Tempera, Panduro). During training the platform was 2 cm under the water surface.
The mice were trained for seven consecutive days with four trials per day. Each mouse was placed in the water close to the wall of the pool in a different quadrant each trial. The order of which quadrant the mice were placed in was changed every day. The mice were allowed to swim freely for 60 s before being led to the platform and forced to sit on the platform for around 5 s before being taken out. One trial was completed for all the animals before starting the next trial, to ensure an intertrial interval of around 15 min for each mouse.
The first probe trial, without the platform, was performed 24 h after the last training trial. The mice were placed in the pool for 30 s before being taken out. A second probe trial, with the same procedure as above, was performed 21 days after the last training day. Training with a new platform location (reversal training) was started after the 21-day probe trial. Reversal training was conducted by repeating the same protocol, but with the platform in a new position in a different quadrant. The animal’s movements in the pool were tracked by Bonsai and analyzed using MATLAB.
The swim patterns of the mice were examined and classified according to six different swimming strategies [42, 43]. The swim strategies are given a cognitive score. The strategies and their scores: thigmotaxis (1), random search (2), scanning (3), indirect search (4), direct search (5), direct path (6). Based on these strategies, cognitive scores were estimated for each day. The cognitive score is the sum of scores in the four trials divided by four to get the mean. Mice that did not swim, but rather floated in the pool for the duration of the trial, were excluded from the analyses.
Open field
The open field box measured 50x50x50 cm. On the day, the animal’s home cage was placed in the room together with the open field box for one hour before testing. The maze was cleaned with ethanol between each session. The animal was placed in the middle of the box, and could explore it freely for five minutes while its movements were monitored using the tracking software ANY-maze. For analysis purposes, the box was divided into the outer- and the inner zone, the inner zone was further divided into the center zone and the middle zone. The inner zone was an approximately 30 cm × 30 cm large square, the center zone a 10 cm × 10 cm square inside the inner zone. However, most of the analysis was done comparing the inner zone as a whole with the outer zone. Each mouse was only tested one time.
Zero maze
The zero maze is a circular track elevated on four legs. It is divided into four zones, two are open, and the other two have walls on the side of the track. Rodents will naturally seek darker areas and will therefore spend most of their time in the maze in the zones with walls. On the day of testing, the cage was placed in the room with the zero maze for approximately an hour before testing. The mouse being tested was placed in one of the walled zones and was then left to explore the maze for five minutes. Movements were monitored using the tracking software ANY-maze. The maze was cleaned with ethanol between each session so that odor from one mouse would not create a distraction for the following mouse. The mice were only put in the maze once, to inhibit habituation.
Bulk tissue qPCR
Bulk tissue was extracted from V1 with a tissue puncher, put in RNAlater solution (Invitrogen) and stored at 4 °C until RNA extraction. For RNA isolation, the tissue piece was added to 600 ul RLT lysis buffer from the RNeasy kit (Qiagen) with added 1% (v/v) 2-Mercaptoethanol. The tissue was homogenized using a TissueLyser II instrument at full speed for 3 min with one stainless steel bead in each tube. The tubes were centrifuged at 4 °C at 20,000 × g for 30 min, and the supernatants were transferred to new tubes. RNA was isolated with the RNeasy mini kit (Qiagen). 1000 ng of RNA from each sample was transcribed to cDNA with FIREScript reverse transcriptase (Solis Biodyne) and random hexamers, using a temperature program of 25 °C 10 min, 50 °C 30 min, 85 °C 5 min, 4 °C. The cDNA was diluted 1:5 with nuclease free water and stored at −20 °C. Two separate rounds of reverse transcription were performed on the RNA, to limit variance in reverse transcription efficiency.
Samples from a total of 22 mice were analyzed; 9 from the ACANflx/PVcre group, 6 from the ACANflx/AAV-PVcre group, and 7 from the PVcre control group. All samples were run on the same plate for each primer specific mix. A volume of 10 μl was used in each well, with 2 μl cDNA, 0.5 μl of each primer (10 μM), and 5 μl LightCycler SYBR Green Mastermix 2× (Roche). LightCycler 96-well plates were run on a LightCycler 96 machine (Roche) with an activation step of 95 °C 120 s; denaturation 95 °C, 10 s; primer annealing 58 °C, 10 s; extension 72 °C, 7 s. Melt curve analysis was performed to check product specificity, and any values without a clean peak were removed. All samples were run in duplicates or triplicates, averaged, and normalized to the combination of GAPDH and Cyclophilin. Data analysis was performed with the steps described in Fig. 5 of the publication from Taylor et al., similar to the ΔΔCq method, to acquire a relative change in expression between the biological sample groups. Tukey’s multiple comparisons test was performed with GraphPad Prism 9.1 software.
qPCR primers can be found in Table S1.
Immunohistochemistry
An overdose of pentobarbital sodium (Euthasol, 100 mg/kg) was administered as an intraperitoneal injection under isoflurane anesthesia. When breathing had slowed and the animal no longer responded to toe or tail pinching, the heart was exposed and perfused transcardially using 10 mL 1× PBS followed by 10 mL of 4% PFA (Sigma, F8775, diluted in 1X PBS). For the brain tissue used for qPCR and western analysis, only cold PBS was used for perfusion. Tissue from the visual cortex was dissected out using a tissue puncher and put on an RNAlater solution (Invitrogen). The brain intended for immunohistochemistry was dissected out and left in 4% PFA for approximately 24 h, before it was transferred to a 30% sucrose solution (prepared in 1× PBS) and left for two days at 4 °C. Sectioning was done using a cryostat (Leica, CM1950), creating 40 µm sections that were transferred to 1× PBS with 0.02% sodium azide for later use in immunohistochemistry. To stain for Hyaluronic acid (HA), Neurocan, Brevican, Tenascin-R and Aggrecan, we initially performed antigen retrieval to un-mask antigens after aldehyde fixation. The sections were placed in a tube with 10 mM sodium citrate solution (pH 8.5–9.0) and left in a water bath maintained at 50 Celsius for approximately 45 min (Jiao et al., 1999). By using the water bath, free floating sections may be heated to a set temperature ensuring minimal damage. The sections were then left in the citrate buffer solution until it reached room temperature. Sections were washed for 3×5 min in 1x PBS on a shaker. Then they were incubated in a blocking solution (3% BSA, 1.5% Triton X-100, in PBS) for one hour. Sections were transferred to the primary antibody solution (1:500 WFA (Sigma-Aldrich, #L-1516)/1:1000 rabbit/goat anti-PV (Swant, #PV27, #PVG-214)/ rabbit anti-ACAN (Merck Millipore, #ab1031), in block) for 24 h at room temperature or 48 h at 4 °C. On day two, sections were washed for 3 × 5 min with 1x PBS before transferring to a secondary antibody solution (streptavidin (#S-11223)/donkey anti-rabbit (#ab150075)/donkey anti-goat (#A-21447), Life Technologies, all with 1:1000) incubated for ~3 h. Sections were washed again for 3 × 5 min with 1x PBS, mounted on Superfrost glass slides, let dry, coverslip using FluorSave™ (Merck Millipore, #345789), and left to cure overnight before imaging.
Imaging
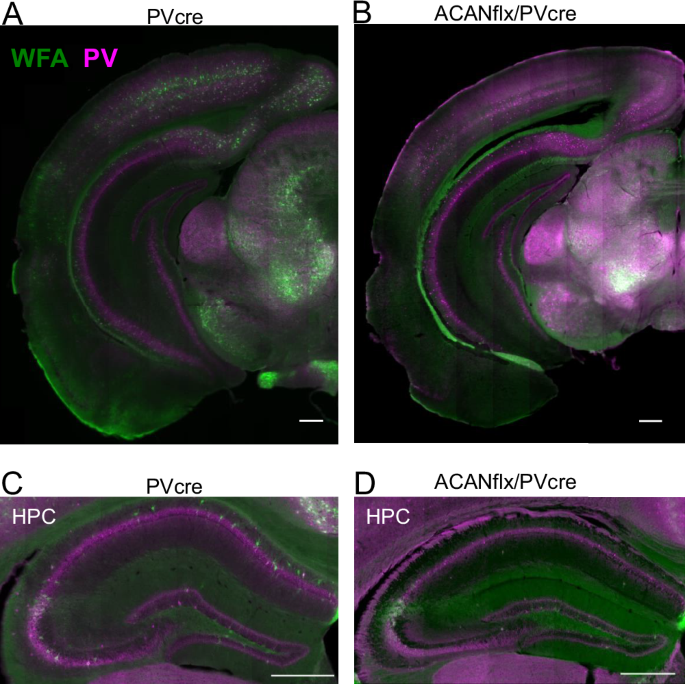
A confocal spinning-disc microscope (Dragonfly, Andor technologies, Oxford Instruments Company) was used to acquire Z-stacks, using Fusion software (Bitplane). The objective (Nikon) used was 20x, dry, NA = 0.75. Each stack was 613 × 613 µm through a volume of 20 µm, made up of individual images acquired with ~0.2 µm spacing in the z direction. Images were taken from the medial prefrontal cortex (AP ~ 1.7, DV ~ 2.3, ML ~ 0.3), retrosplenial cortex (AP ~ −1.94, DV ~ 1.0, ML ~ 0.3-0.7), visual cortex (AP ~ −3.0, DV ~ 0.8, ML ~ 3.0) (coordinates relative to bregma). Tile images were taken using the AxioScan Z1 slide scanner with the ZEN lite Blue software (Carl Zeiss). Z-stacks were flattened by creating a maximum intensity projection in ImageJ. Cellpose was used to automatically segment PV+neurons for analyzing numbers of cells [71]. ImageJ was used for the manual counting of overlap between WFA+ and PV+ neurons. The counting was performed by a blinded subject.
Statistics and graphical design
Statistics and figures were made using GraphPad Prism 8 or 9. Statistical significance was assessed using either a repeated measures ANOVA/Mixed effect analysis with a Sidak’s multiple comparisons test, an unpaired student t-test of variance or a Kolmogorov-Smirnov test for the FI curves. Significance level were marked as *p < 0.05, **p < 0.01, and ***p < 0.0001. Biorender.com was used to create the illustrations.


Comments (0)