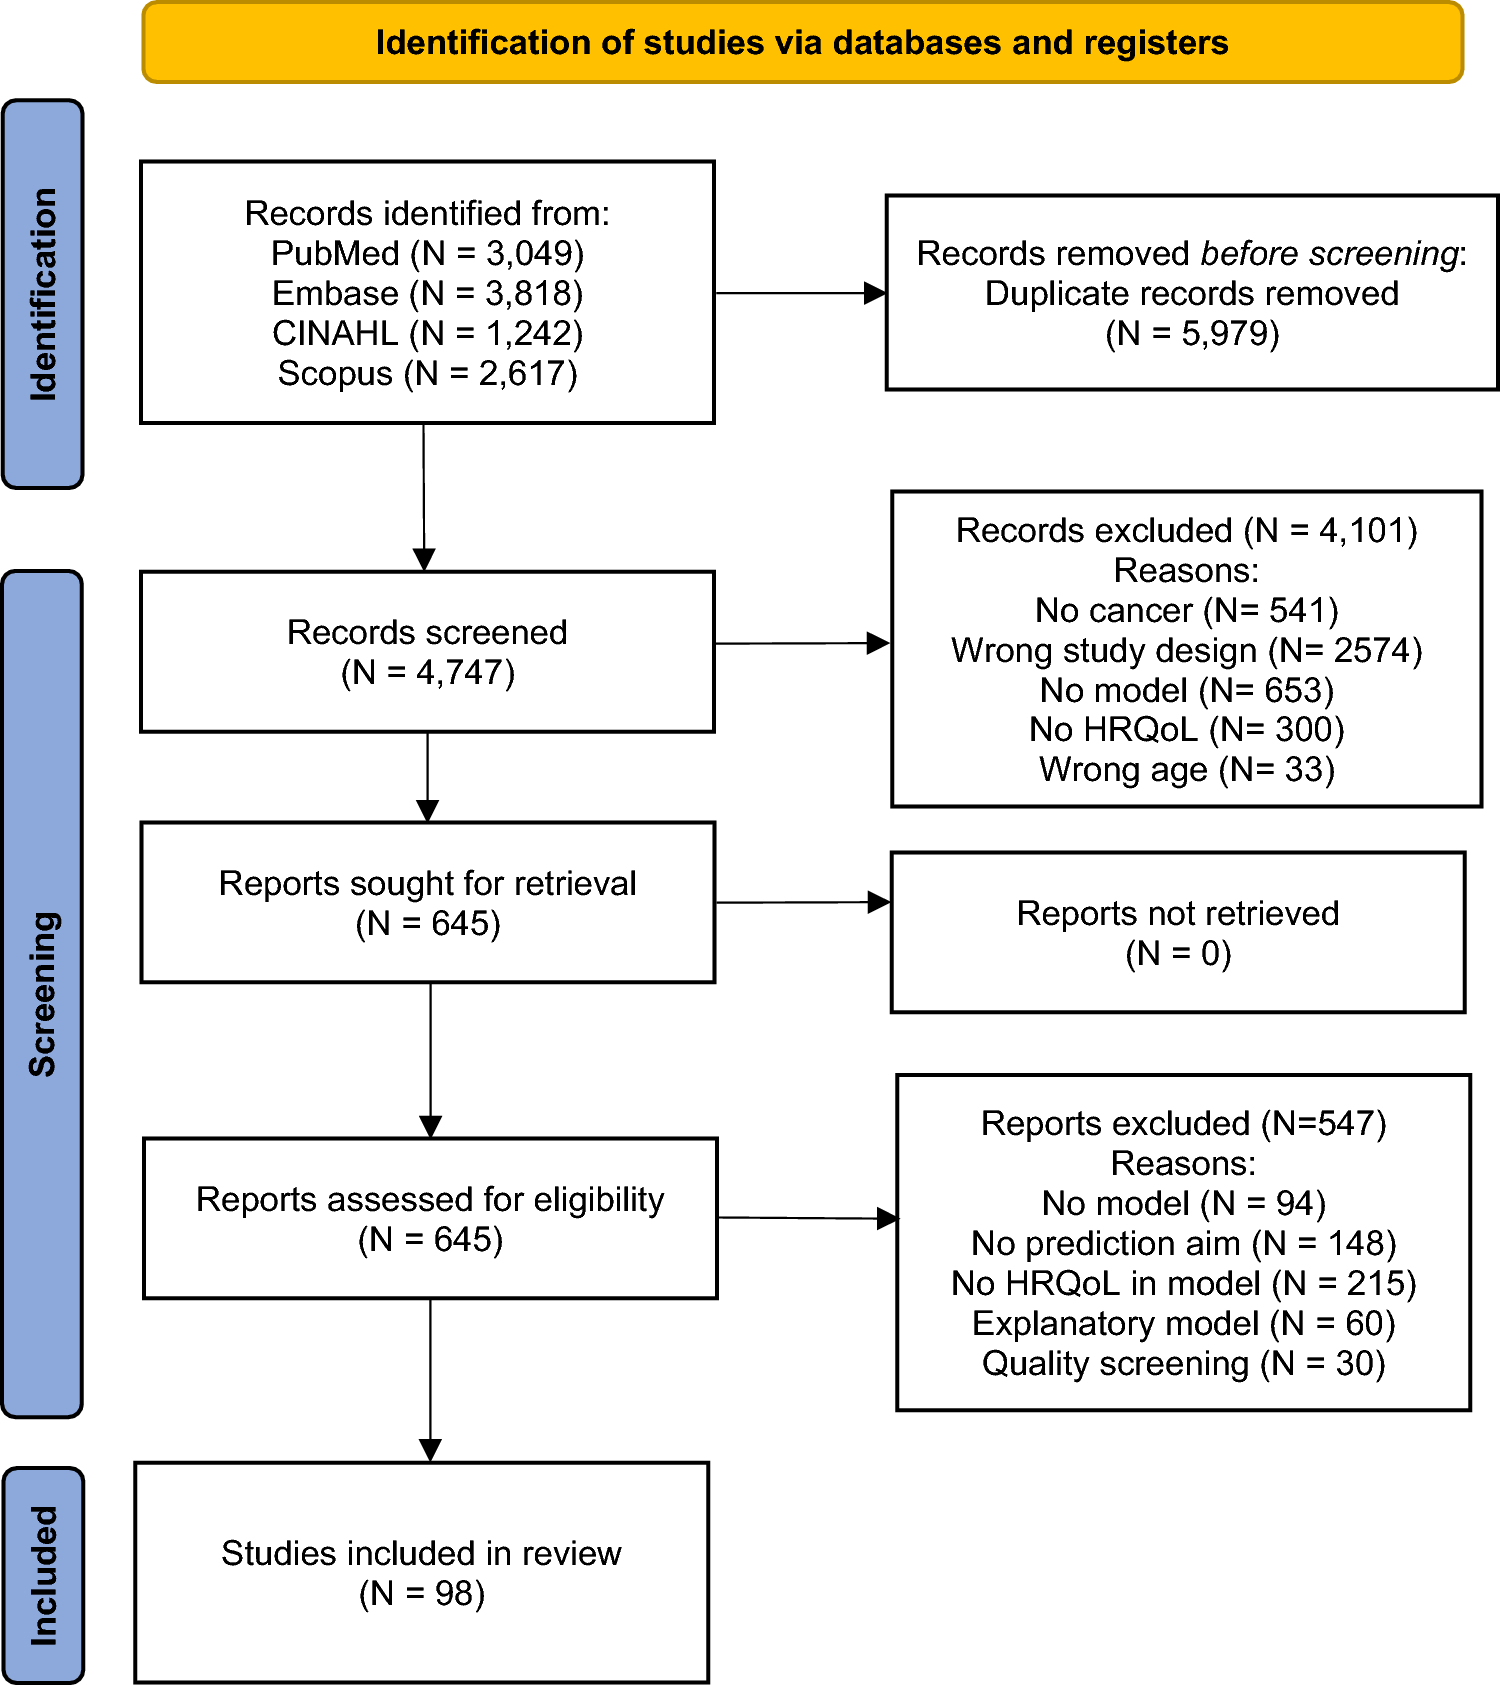
PROMIS physical function item bank and its translation
Physical Function (PF) is the ability to perform activities requiring physical actions, which range from basic self-care to more complex tasks needing various skills, often within social contexts [8]. The PROMIS Physical Function item bank is an Item Response Theory (IRT)-based calibration of a graded response model, which allows for any subset of these items to measure an individual's PF on a standardized T-score scale, representing an average of 50 and a standard deviation of 10 in the general population [14, 15]. The PROMIS PF version 1.2 itembank consists of 121 items that evaluate the ability to perform tasks using the upper extremities (such as hand dexterity), lower extremities (such as walking and level of mobility), and central body areas (neck and back), alongside the ability to undertake instrumental daily living activities, such as running errands. For the development of PROMIS PF 2.0 item bank, 35 additional items were added to extend the measurement range, in particular for individuals with good physical functioning.
These 35 items were translated into German and Spanish following the PROMIS Standards [13]. The process included creating a glossary for accurate term translation, forward and backward translations by native speakers, and cultural adaptations for regional differences. The German and Spanish versions were refined through cognitive debriefing with participants from Germany and Argentina, using feedback to ensure clarity and cultural relevance. At least 5 cognitive interviews are conducted to ensure the quality and appropriateness of the translations. The project was overseen by the PROMIS Translation Director, who ensured consistency and finalized the translations with certification, emphasizing the rigorous approach to maintaining the integrity and universality of the translations.
Data collection
Data from the general population was collected in online panels in Argentina and Germany, targeting adults fluent in Spanish or German respectively, using quotas for age and sex to resemble the joint marginal distribution in the general population. By selecting a general population sample, we ensured a mixture of different health states. This approach increases the likelihood of including individuals across the full spectrum of physical functioning, including those at the high-functioning end. Individuals who do not speak the language of administration and those unable to consent were excluded. Data was collected by a social research institute (Cint Deutschland GmbH). Comparable data from English-speaking subjects were already collected as part of the research project that developed the extended item bank through a US-based market research firm (Opinions for Good [Op4G]).
Besides PF, we collected sociodemographic variables and assessed overall health status of the participants with four items from the PROMIS Global Health Physical and Mental 2a two-item short forms [7]. The Physical Health short form consists of items Global03 (In general, how would you rate your physical health?) and Global06 (To what extent are you able to carry out your everyday physical activities such as walking, climbing stairs, carrying groceries, or moving a chair?). The Global Mental Health items are Global04 (In general, how would you rate your mental health, including your mood and your ability to think?) and Global05 (In general, how would you rate your satisfaction with your social activities and relationships?). The PROMIS Global Health measures were not collected in the USA.
Unidimensionality
The items of a test are considered as unidimensional if they all measure the same, single, latent construct, in this case physical function. To evaluate the theoretical assumption of unidimensionality of the construct and to establish the foundations for using Item Response Theory (IRT) models, we performed a confirmatory factor analysis (CFA), a graded response model (GRM), and an exploratory bifactor model. This model decomposes item variance into a general factor and specific factors. We reported Explained Common Variance (ECV), the ratio of the general factor eigenvalue to the sum of all eigenvalues, which indicates unidimensionality. Additionally, we estimated coefficient omega (omega H) to assess the general factor saturation of the test [29].
We used the following fit statistics and thresholds to indicate good model fit: root mean squared error of approximation (RMSEA) < 0.06, standardized root means square residual (SRMR) ≤ 0.08, comparative fit index (CFI) ≥ 0.95, and Tucker-Lewis index (TLI) ≥ 0.95 [17]. To determine how well a unidimensional graded response model fitted the data, the M2* test statistic was calculated [3]. As suggested by Reise et al. (2013), we used the explained common variance by the general factor (ECV, cut-off < 0.6) as well as the coefficient omega hierarchical (OmegaH, cut-off > 0.8) as additional indicators of sufficient unidimensionality.
Monotonicity
Monotonicity refers to a consistent, non-decreasing relationship between individual item scores and the levels of the underlying construct they measure. If one respondent scores higher on a specific item than another, their total score on the assessment should reflect this by not being lower than the score of the second respondent. For our analysis, we adopt the threshold of Loevinger's H values greater than 0.3 as an indicator of monotonicity, following the guidelines suggested by Sijtsma and Molenaar [20], which compares the number of violations to this pattern to the number that would be expected in a set of unrelated items [25].
Item independence
The assumption of independence posits that the relationship between any two items is solely mediated by the construct they measure. To examine this, we used Yen's Q3 residual covariance statistic, adopting a criterion where values greater than 0.2 signal the presence of local dependence between items, as noted by [5]. Elevated residual covariance implies that responses to one item might influence responses to another or that both items are capturing an additional, unintended construct.
Measurement invariance
Measurement invariance refers to the stability of the relationship between item responses and levels of the physical function, irrespective of population subgroup, such as countries [24]. Violations of measurement invariance indicate differential item functioning (DIF), a phenomenon that can skew the interpretation of an item's measurement across diverse contexts and lead to bias.
To illustrate, consider an item that asks about difficulties encountered when using public transportation. At similar levels of physical function, respondents from countries with well-developed public transportation systems, like Japan or Germany, might report fewer difficulties compared to respondents from countries where public transport systems are less accessible, such as in some rural areas of the United States. Hence, the item does not equally measure physical function across different country contexts, but rather reflects differences in infrastructure, accessibility, and culture related to transport e.g., quality, use, and access to public transport.
DIF can manifest in two distinct forms: uniform and non-uniform. Uniform DIF occurs when a specific comparison group (e.g., respondents from a given country) consistently shows a higher or lower likelihood of selecting responses across all levels of the underlying trait. Non-uniform DIF, however, occurs when the impact of the underlying trait on the likelihood of selecting a certain response category differs across groups. This means that the relationship between the trait level and the probability of a particular response is not consistent across groups. For example, at lower levels of physical function, respondents from one group might be more likely to choose certain categories compared to another group, but this pattern might change at higher levels of physical function. This variation can indicate that different groups interpret or value the items differently depending on their trait levels, which can result in differentiated item slopes for each group [24]. Non-uniform DIF is therefore characterized by an interaction between group membership and trait level in predicting responses.
In our analyses, we investigated DIF using the ordinal logistic regression framework [4]. This method compares the fit of different ordinal logistic regression models to predict item responses to an item based on the latent construct. If DIF exists, the addition of the covariate of interest (e.g. country) improves model. Using this framework, a main effect for the covariate is indicative of uniform DIF, while the interaction between the conditioning score and the covariate would represent non-uniform DIF.
Within this framework a wide range of plausible analysis strategies are possible and analytic choices and decisions can influence the results and conclusions drawn from the analysis. To ensure the robustness of our findings, we decided to conduct a multiverse analysis approach to include all plausible choices [19, 21,22,23]. This novel approach, which we term 'Multiverse DIF analyses', involves systematically varying the analytic choices across the entire range of plausible options and examining how these choices affect which items are flagged for DIF.
Specifically, we varied the following factors:
(1)
the country comparison (so we compared either all three countries simultaneously, or compared USA with Argentina, USA with Germany, or Argentina with Germany);
(2)
whether or not to include age as predictor in the ordinal regression models, as the Argentinian sample was on average nine years younger. Age was included as a linear effect and an interaction term with country to account for potential differences in how age affects physical function across countries;
(3)
the parameters for the Item Response Theory (IRT) model to estimate the latent trait (either using established PROMIS parameters or estimating parameters from the data at hand using a multigroup GRM);
(4)
the detection criterion for DIF, including likelihood ratio tests (LRT), LRT with Bonferroni correction, LRT with Benjamini–Hochberg correction, change in beta, and pseudo R2 values (Cox-Snell, Nagelkerke, McFadden); and
(5)
the respective flagging criteria, meaning the threshold for determining the presence of DIF, with different values for LR (0.02, 0.03, 0.05), Beta (0.01, 0.05), and R2 (2%, 3%, 5%).
Overall, this gives 272 unique combinations. We assessed the frequency with which each item was flagged across all analytical strategies. This approach enabled us to pinpoint specific items that consistently exhibited DIF and to identify which analytic decisions led to significantly divergent outcomes.
Impact of DIF
To comprehensively assess the potential impact of DIF at the item level, we employed a visualization strategy. We compared models ignoring and accounting for DIF between languages, using Bland–Altman Plots to compare T-Scores across the spectrum of PF. We also compared the overall distribution of T-Scores in each sample and assessed the test characteristic curve.
Open science practices
All data and R code for reproducible data analysis can be found at the Open Science Framework (https://osf.io/c75qv/). As PROMIS item parameters are proprietary, we followed recommendations to perturbate item parameters [10].


Comments (0)