Mouse strains and housing
The mutant mouse strain deficient for Omd used for this research project, C57BL/6 Omdtm1Lex/Mmucd, RRID: MMRRC_011749-UCD, was obtained from the Mutant Mouse Resource and Research Center (MMRRC) at the University of California at Davis, an NIH-funded strain repository, and was donated to the MMRRC by Lexicon Genetics Incorporated. The mutation targeted coding exons 1 and 2 by homologous recombination. The genotyping protocol from MMRRC was applied. The overexpressing mouse strain for Omd used for this research project, C57BL/6 Tg(Bglap-Omd)1Kieg, EMMA ID EM:02120, was obtained from the European Mouse Mutant Archive (EMMA), a repository supported by the national research programs and by the EC’s Research and Innovation program Horizon 2020. The transgenic line expressed Omd under the osteocalcin promoter in addition to its natural expression; hence, Omd overexpression was only osteoblast specific. Strains were crossed with WT C57BL/6 mice to maintain the line. Transgenic, WT, and mutant mice were maintained on a 12-h light/dark cycle with food and water supplied ad libitum. To simplify the nomenclature in the paper, we refer to the Omd-deficient mice as “KO” and to the Tg(Bglap-Omd) as “UP”. The ethics committee of the University of Liège approved all experimental procedures (reference no. 19-2090).
Mouse model of OA
Posttraumatic OA was induced by DMM in the UP, WT, and KO strains at 16 weeks. The surgical transection of the medial menisco-tibial ligament of the right knee was performed to induce mild instability of the knee.52 The mice were euthanized 12 weeks after surgery, and their knees were histologically analyzed.
For spontaneous OA, UP, WT, and KO mice were euthanized at 16 months, and their knees were histologically analyzed.
Knee joint histology and histomorphometry
Knee joints of the mice, at 4, 8, 16 months, and 28 weeks from the DMM model, were fixed for 24 h in 4% paraformaldehyde (PFA) at 4 °C, followed by decalcification in hydrochloric acid (DC2 medium; Labonord) for 2 h and 30 min at 4 °C and then washed in Milli-Q water overnight at 4 °C before embedding in paraffin. Coronal sections of 5 μm were cut within the central area with 3 sections at least 80 μm apart selected for analysis with Safranin-O Fast Green staining. An additional central section was used for Toluidine blue staining. Each compartment of the knee joint was scored by two readers following OARSI guidelines for the mouse model as described in ref, 53 and the mean score from the 3 sections was calculated.
Histomorphometry of the sections was performed with QuPath version 0.3.2 software.54 The sections were photographed at ×10 magnification. Cartilage histomorphometry analysis was performed on sections stained with Toluidine blue. The total cartilage, calcified cartilage, plate length, and growth plate area were measured. For the growth plate, the area was measured inside a consistent circle of a fixed size under the articular plateau. The subchondral bone area analysis was performed on the 3 sections stained with Safranin-O Fast Green. The bone area was measured under the tibial plateau according to its length, and the bone marrow area was removed. The measured region of interest (ROI) is explained in Fig. S8.
Immunohistochemistry
Epitope retrieval was performed using chondroitinase ABC (50 units per mL, Sigma-Aldrich) in 60 mmol·L−1 sodium acetate and 100 mmol·L−1 Tris (pH 8) for 30 min at 37 °C. Animal-free blocking solution (Cell Signaling Technology, dilution 5X) was used to block the sections prior to overnight incubation with the primary polyclonal goat antibody anti-mouse OMD (R&D Systems, AF3308, 0.8 μg·mL−1) in antibody diluent (Dako, S2022). The sections were then incubated for 30 min with the secondary polyclonal rabbit antibody anti-goat coupled with HRP (DakoP0449, dilution 1:400) diluted in Antibody diluent. Visualization of the secondary antibody was performed by using DAB (Cell Signaling Technology, 8059) for 2 min. Sections were counterstained with hematoxylin from Carazzi (Sigma-Aldrich) for 4 min.
Microcomputed tomography (µCT) and image analysis
Tibiae from mice were dislocated and fixed for 24 h in 4% PFA at 4 °C and transferred into phosphate-buffered saline (PBS) for storage at 4 °C. Samples were imaged using a Phoenix NanoTom M (GE Measurement and Control Solutions, Germany). A diamond target was applied, and scans were operated at a voltage of 60 kV, a current of 170 μA, and a voxel size of 3 µm. An aluminum filter of 0.2 mm was used to reduce beam hardening during the acquisition. The exposure time was 500 ms, and 1 800 images were acquired over 360° using the fast scan mode (frame averaging = 1; image skip = 0). During reconstruction (Datos|x, GE Measurement, and Control Solutions), we applied a beam hardening correction of 8. After reconstruction, scans were oriented in the same plane using DataViewer (Bruker MicroCT, Kontich, Belgium). Images were analyzed using CTAn (Bruker MicroCT, Kontich, Belgium). For assessment of the trabecular architecture, we selected 150 images (450 µm height) starting at 30 μm below the growth plate level. Using 3D analysis, the trabecular volume (BV), total ROI volume (TV), number of trabeculae, porosity, and structure model index (SMI) were calculated. For analysis of the cortical architecture, we selected 100 images (300 µm height) starting at 1 500 μm below the growth plate level and corresponding to the mid-shaft. Using 3D analysis, the BV, TV, cortical thickness, porosity and tibial crest length were calculated. 3D visualization was performed using CTVox (Bruker MicroCT, Kontich, Belgium). The subchondral bone of the tibia, showing a coronal view of the medial and lateral plateaus, was also visualized in 3D using CTVox, and a 2-D visualization was generated using DataViewer.
CatWalk XT
The gait analysis of the mice was performed using the CatWalk XT System (Noldus, Netherlands; software version XT 10.5). The CatWalk XT platform was placed in a dark and silent environment to enhance the quality of the recording and reduce animal stress. The same detection settings were used for each mouse: camera gain of 18.99 dB, green intensity threshold of 0.1, detection threshold of 0.1 a.U, red ceiling light of 17.2 V, and green walkway light of 16.5 V. The gait was recorded, and the CatWalk XT software automatically labeled the footprint and generated the various associated gait parameters for the compliant runs. A compliant run was defined as a run where the mouse did not stop while going through the walkway with at least 12 footprints, the maximum variation was set at 60%, and the speed was between 10 and 45 cm·s−1. At least 3 runs for each mouse were recorded, and the data represent the mean value. The data from the left and right paws were pooled for the front and hind paws to simplify the run parameter visualization.
Zebrafish husbandry and strains
Zebrafish (Danio rerio) were raised in standard conditions as described in ref. 55 Mutant lines deficient for omd were generated using CRISPR‒Cas9 mutagenesis with the guide RNA 5’-CAA-GAG-CTG-CGC-CAA-TG-TCA-3’. The gRNAs targeting omd were incubated with Cas9 protein (Thermo Fisher Scientific) before microinjections into 1-cell stage zygotes. The mutation targeted the START codon. The reporter line used to visualize osteoclasts is the transgenic line TgBAC(ctsk:Citrine)56 and was kindly provided by Prof. Stefan Schulte-Merker. The ethics committee of the University of Liège approved all experimental procedures (references no. 16-1961 and 19-2133).
Injection of mRNA of omd in the Zebrafish
For omd overexpression, zebrafish omd mRNA and GFP mRNA, serving as a control, were microinjected into 1-cell stage zygotes. The following primers were used to generate the omd mRNA: forward 5’-CGA GAG AGA TAT TCA ATC CCA CAG-3’ and reverse 5’-TCA ACC AAC AAG GAA TGG AAG-3’. The T7 promoter sequence for in vitro mRNA synthesis with the mMessage mMACHINE®T7 Ultra kit (Invitrogen) was added afterward with nested PCR using the forward primer 5’-GCG AAT TGT AAT ACG ACT CAC TAT AGG GCC ACC ATG ACA TTG GCG CAG-3’. Fertilized eggs were injected with either 0.4 ng or 0.8 ng of mRNA. Phenotypic characterization was performed at 24 hpf and 4 dpf. At 4 dpf, the larvae were fixed with 4% PFA overnight at 4 °C and then stained with Alcian blue as described in ref. 57
Whole-mount in situ hybridization in zebrafish
Zebrafish larvae at 48 hpf, 5 dpf and 8 dpf were used for whole-mount in situ hybridization. Larvae were raised in the presence of 0.003% 1-phenyl-2-thiourea until 5 dpf to avoid pigmentation development. Larvae were fixed overnight in 4% PFA at 4 °C and stored in 100% methanol at −20 °C until use. Visible in situ hybridizations were performed as described in ref. 58 with a digestion step with Proteinase K (Thermo Scientific) at 40 μg·mL−1 for 30 min at 37 °C for the 48 hpf larvae, at 50 μg·mL−1 for 30 min at room temperature, and at 40 μg·mL−1 for 50 min at room temperature for the 8 dpf larvae.
Histology of the zebrafish jaw joint
One-year-old zebrafish were fixed with 4% PFA at 4 °C for a minimum of 24 h and decalcified in 1 mol·L−1 EDTA solution for 20 days. Zebrafish were dehydrated in ethanol, embedded in paraffin, and sagittally sectioned at 5 µm. Sections showing the jaw joint were stained with Toluidine blue. The OARSI score was attributed to 1 section per jaw joint as described in ref. 32
Zebrafish osteoclast assay in the caudal fin
The omd x TgBAC(ctsk:Citrine) mutants were used at 1 year for the osteoclast analysis. Their caudal fins were cut, and the fins were allowed to regenerate for 7 days. Regenerated caudal fins were cut for analysis and incubated for 20 min with 0.01% Alizarin red S (Sigma‒Aldrich) to stain the mineralized bone matrix. Quantification of fluorescence from regenerated rays was performed using ImageJ software.59
TRAP staining of the zebrafish scales
Ontogenetic scales of 1.6-year-old fish were plucked from the flank of the zebrafish and fixed with 4% PFA at room temperature for 30 min. Scales were incubated for 2 h in the TRAP staining solution as described in ref. 60 Quantification of TRAP staining was performed using ZFBONE software on FIJI.61
Human trabecular osteoblast culture and RNA-seq analysis
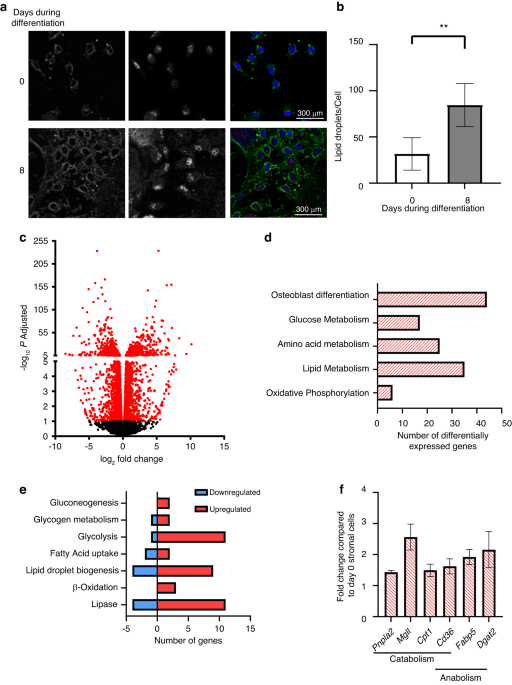
Tibial bones were obtained from 6 male and 5 female patients undergoing total knee replacement surgery for OA. The age of the patients ranged from 58 to 89 years. All tissue samples used in this study were obtained after receiving approval from the University of Liege Medicine Faculty ethics committee (No. B70720108313, reference 2010/43), and written informed consent was obtained from each subject. Nonsclerotic trabecular bone was easily removed from the tibia with surgeon pliers and enzymatically processed to obtain digested bone pieces cultured as described in ref. 62 At confluence, osteoblasts were collected by trypsinization and seeded (22 000 cells per cm2) in 12-well plates (Nunc). Osteoblasts were cultured until confluence and then switched into differentiation media as described in ref. 62 for 3 days in the presence of 10 ng·mL−1 human recombinant OMD (R&D Systems, 2884-AD) or its absence for the same patient, serving as its own control.
Total RNA was extracted from osteoblast cultures, with RNA quality indicator scores (RIN) of 9.3, and RNA-seq for differential gene expression analyses was performed with a false discovery rate (FDR) of 0.01 to assess the statistical significance as described in ref. 63
Solid phase binding assay
Human recombinant RANKL (OriGene, Germany) was bound for 2 h under constant agitation to Well-Coated™ Nickel (G-Biosciences) previously washed with PBST. Unbound protein was removed by repeated washing with PBST. RANKL-coated plates were incubated overnight at 4 °C with human recombinant OMD (R&D Systems). The OMD bound to the coated plate was detected using the primary biotinylated polyclonal goat antibody anti-human OMD (R&D Systems, ref: BAF2884, 0.4 μg·mL−1). Plates were incubated with streptavidin-POD (Roche, dilution 1:25 000) for 30 min for detection. Finally, plates were read at 450 nm after applying TMB (TMBplus2, D-Tek, Denmark) for 8 min. The direct binding between OMD and RANKL was assessed with a fixed concentration of RANKL (0.2 μg·mL−1) and decreasing concentrations of OMD (1 000 to 15.65 ng·L−1 by serial 2X dilution), with the negative control missing RANKL; and with decreasing concentrations of RANKL (800 to 6.25 ng·mL−1 by serial 2X dilution) and fixed concentration of OMD (0.5 μg·mL−1), with the negative control missing OMD.
Mouse osteoclast culture
WT mice of at least 4 months of age were used to collect bone marrow cells. The bone marrow of the femur and the tibia was flushed with 10 mL of αMEM containing 10% FBS, 100 U per mL penicillin, and 100 mg·mL−1 streptomycin. Cells were strained through a 70 µm filter and then centrifuged at 1 200 r·min−1 for 7 min at 22 °C. After centrifugation, cells were suspended in 12 mL of media containing 5 ng·mL−1 M-CSF in a petri dish and incubated overnight at 37 °C. The nonadherent cells were centrifuged at 1 200 r·min−1 for 7 min at 4 °C the next day. The cells were suspended in the osteoclast differentiation medium αMEM containing 10% FBS, 100 U per mL penicillin, 100 mg·mL−1 streptomycin, 30 ng·mL−1 M-CSF and 10 ng·mL−1 RANKL. For the treatment conditions, 10 and 40 ng·mL−1 recombinant mouse OMD (R&D Systems) were preincubated for at least 15 min with RANKL and M-CSF prior to addition to the suspension of the cells. Cells were seeded (525 000 cells per cm2) in 24-well plates. Cells were maintained until 4 days of differentiation and were stained with a TRAP staining kit (Sigma-Aldrich) according to the manufacturer’s instructions.
Assay in the serum for bone turnover markers
Serum was extracted from the blood of 16-month-old mice collected at euthanasia. The level of P1NP was measured by Rat/Mouse P1NP ELISA (Immunodiagnostic Systems, Boldon, UK), and the level of TRAcP 5b was measured by the Mouse TRAP Assay, a solid phase immunofixed enzyme activity assay (Immunodiagnostic Systems, Boldon, UK), according to the manufacturer’s protocol.
Mechanical testing
The biomechanical properties of the tibia of 16-month-old mice were determined using a three-point bending test in an Instron 5565 tensile testing machine. Tibiae were stored in PBS, and the remaining soft tissues and fibulae were carefully removed. The samples were assessed at room temperature on a special holding device on their anteroposterior axis. Force was applied on the midpoint of the tibia diaphysis with a 100 N load cell at 8 mm separation (span length) with a perpendicular constant speed of 0.05 mm·s−1 and with a preload of 1 N until it fractured. From the load‒deformation curve, the values for the maximal load (N) and stiffness (N·mm−1) were obtained.64
Statistical analysis
The results were statistically analyzed using GraphPad Prism 6.0. The tests performed and statistical significance are indicated in the figure legends, with P values < 0.05 considered statistically significant.

Comments (0)