
Remember me



This is a prospective cohort study. The report follows the STROBE (Strengthening the Reporting of Observational Studies in Epidemiology) guidelines [23]. Approval for the study was obtained from the Ethics Committee of West China Hospital of Stomatology, Sichuan University (Approval No. WCHSIRB-D-2022–171), and the trial was registered with the Chinese Clinical Trial Registry (http://www.chictr.org.cn/) under registration number ChiCTR2300070538 (retrospective registration date: 14/04/2023). The study was conducted in full compliance with the 1975 Declaration of Helsinki (revised in 2013) [24]. Surgical interventions were performed with the understanding and written informed consent of each participant. All surgeries were conducted by the same experienced clinician (M.A.C.).
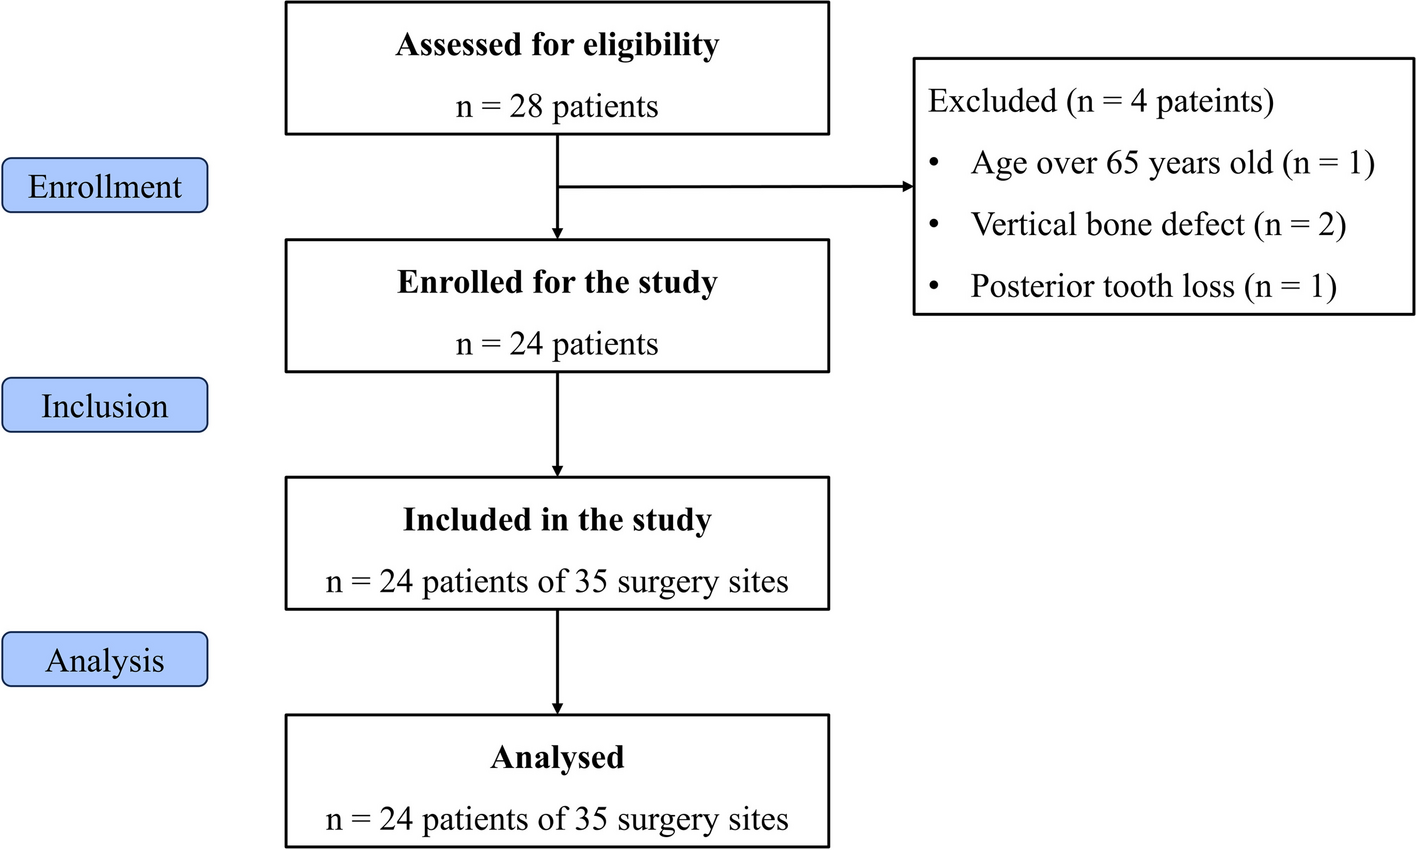
Patient enrollmentA total of 24 patients were selected between April 2022 and April 2024, all of whom presented with anterior tooth loss and Terheyden 1/4 to 2/4 labial bone plate defects requiring bone augmentation. The patients were treated in the Department of Implant Dentistry at our hospital.
The inclusion criteria were as follows: (i) age between 18 and 65 years (inclusive of 18 and 65), with no gender restriction; (ii) anterior tooth loss with Terheyden 1/4 to 2/4 labial bone plate defect requiring GBR; (iii) the patient was in good overall health and able to tolerate surgery; (iv) the participant fully understood the benefits and risks of the trial, was willing to participate, and signed the informed consent form.
The exclusion criteria were: (i) general medical conditions such as previous radiotherapy to the maxillofacial region, uncontrolled diabetes, uncontrolled hypertension, systemic steroid therapy, systemic bisphosphonate therapy, pregnancy, or breastfeeding; (ii) smoking; (iii) periodontal conditions such as untreated periodontitis or high levels of residual inflammation (whole-mouth plaque index ≥ 25%, bleeding on probing score, BOP% ≥ 10%).
Case selection followed strict inclusion and exclusion criteria, as outlined in Fig. 1.
Fig. 1 Preoperative preparation
After thoroughly explaining the study's purpose, benefits to participants, surgical procedures, risks, and timelines, participants were asked to read and sign the informed consent form. Preoperative cone-beam computed tomography (CBCT) and intraoral scans were performed before alveolar ridge augmentation. The data were imported into Simplant design software (Simplant Pro 17.01, Dentsply Sirona, York, PA, USA) to plan the three-dimensional position of the implant and the extent of bone augmentation guided by prosthetic-driven planning. The cases were classified into Terheyden 1/4 and 2/4 group based on the degree of implant exposure in the alveolar bone (Fig. 2). Preoperative design files were saved in SPR format, and surgical guides for implant placement were generated and manufactured for the concurrent group.
Fig. 2
Grouping method: The cases were classified into Terheyden 1/4 group (A) and Terheyden 2/4 group (B) based on the degree of virtual implant exposure in the alveolar bone
At least one week before surgery, participants received periodontal treatment.
Surgical procedureThe surgeries were conducted by the same experienced implantologist (A.C.M.).
Surgical interventions were performed under local anesthesia with 4% articaine and 1:100,000 epinephrine.
Terheyden 1/4 groupA trapezoidal incision was made in the edentulous area using a #15 surgical blade according to the extent of the bone defect. A full-thickness flap was elevated to fully expose the bone defect area, and all remaining soft tissue on the exposed bone surface was removed. A 0.8 mm bur was used to perforate the cortical bone in the recipient area, allowing penetration into the medullary bone to improve graft vascularization. A periosteal releasing incision was made on the labial side with a #15 blade, and adequate flap tension was released to ensure tension-free primary closure of the wound (Fig. 3B). Under the guidance of the surgical stent, sequential drilling of the implant bed was performed, and the implant was placed (Fig. 3C-D). A mixture of xenograft material (Bio-Oss, Geistlich Pharma AG, Wolhusen, Switzerland) and allograft bone material (Bio-DBM, Osteolink, Hubei, China) in a 1:1 ratio was prepared by mixing in a sterile bowl and moistened with saline. The bone graft mixture was placed into the bone defect to restore the ideal contour of the bone arch (Fig. 3F). A bovine pericardium collagen membrane (Megreen, Reshine Biotechnology, Shanxi, China) was trimmed to the appropriate size and placed over the graft material, and the membrane was secured with sutures (PROLENE™ Polypropylene Suture, Johnson & Johnson MedTech, New Brunswick, NJ, USA) or titanium pins (MatrixMIDFACE, Depuy Synthes, Warsaw, NY, USA) (Fig. 3G). The wound was closed using horizontal mattress sutures and interrupted sutures (Fig. 3H). Postoperative CBCT scans were performed immediately. Sutures were removed two weeks postoperatively. Any complications, such as wound dehiscence or infection, were recorded. Patients were recalled for a six-month follow-up CBCT scan, after which the final prosthetic restoration was completed (Fig. 3K-L).
Fig. 3
The treatment procedure of Terheyden 1/4 Group. A, E: Occlusal view before surgery and 6 months post-surgery; B: Flap elevation; C: Implant placement; D: Occlusal view of the implant shows a thin labial bone plate; F: Allogeneic and xenogeneic bone grafts placement; G: Bovine pericardium collagen membrane covering, secured with titanium pins; H: Tension-free, precise suturing; I: Occlusal view of the temporary restoration; J: Frontal view of the temporary restoration; K: Frontal view of the final restoration; L: Occlusal view of the final restoration
Terheyden 2/4 groupIn this group, the same incision, flap elevation, and cortical perforation were performed (Fig. 4A). A 1 mm thick cortical bone block (Bio-DBM, Osteolink, Hubei, China) was pressed against the labial side of the graft material and secured with one or two self-tapping titanium screws at the recipient site (Fig. 4B). After fixation, any sharp edges of the bone block were smoothed to prevent postoperative exposure or dehiscence. A mixture of xenograft material (Bio-Oss, Geistlich Pharma AG, Wolhusen, Switzerland) and allograft bone material (Bio-DBM, Osteolink, Hubei, China) in a 1:1 ratio was tightly packed into the bone defect (Fig. 4C). A bovine pericardium collagen membrane (Megreen, Reshine Biotechnology, Shanxi, China) was trimmed and placed over the graft, secured with sutures (PROLENE™ Polypropylene Suture, Johnson & Johnson MedTech, New Brunswick, NJ, USA) or membrane nails (MatrixMIDFACE, Depuy Synthes, Warsaw, NY, USA) (Fig. 4D). The wound was closed using horizontal mattress sutures and interrupted sutures (Fig. 4E). Immediate postoperative CBCT scans were performed. Sutures were removed two weeks postoperatively. Any complications, such as wound dehiscence or infection, were recorded. Patients were recalled for a six-month follow-up CBCT scan, and the final implant placement (Fig. 4F-J) and prosthetic restoration were completed (Fig. 4O).
Fig. 4
The treatment procedure of Terheyden 2/4 Group. A-E: Bone augmentation surgery. A: Flap elevation and preparation of nourishing holes; B: Thin cortical allograft fixed with titanium screws; C: Tight packing of particulate allograft and xenograft; D: Bovine pericardium collagen membrane covering, secured with sutures; E: Tension-free, precise suturing. F-J: Implant surgery. F: Flap elevation and removal of titanium screws; G-H: Implant placement guided by surgical guide plate; I: Occlusal view of the implant; J: Frontal view of the implant, no thread exposure. K-M: Occlusal views at preoperative, 6 months after bone augmentation, and 3 months after implant surgery. N: Frontal view of the temporary restoration; O: Frontal view of the final restoration
Postoperative careAn ice pack was immediately applied to the donor and recipient sites. Postoperative instructions were provided to patients, including oral hygiene measures, the use of a 0.12% chlorhexidine mouthwash, and medication regimens (diclofenac sodium sustained-release tablets 75 mg, once or twice daily; amoxicillin capsules 500 mg, three times daily; ornidazole dispersible tablets 500 mg, twice daily; continued for five days).
Measurement indicesAll measurements were performed by a calibrated examiner (Y.J.Z.) who was not involved in the study. The examiner randomly selected ten patients for measurement and repeated the measurements for these patients after two weeks. An intraclass correlation coefficient (ICC) test was conducted for the two sets of measurements, yielding an ICC of 0.92, indicating excellent consistency in the results.
Linear radiographic evaluationAll patients underwent three cone-beam computed tomography (CBCT) scans under the same projection conditions (3D Accuitomo 170, J. Morita Mfg. Corp., Kyoto, Japan) with the following exposure parameters: tube current: 5 mA, tube voltage: 90 kV, exposure time: 17.5 s, voxel size: 0.25 mm, slice thickness: 0.25 mm, field of view: 140 × 100 mm. The CBCT scans were taken at three time points: preoperatively (T0), immediately postoperatively (T1), and six months postoperatively (T2). For radiographic evaluation, virtual implants placed during preoperative planning, based on prosthetic-guided and guided regeneration principles, were used as reference markers. Following the method proposed by Jiang et al., the DICOM files from the T1 and T2 CBCT scans were converted to STL files using Simplant software and imported into the preoperative design file. The STL files were overlaid onto the T0 CBCT scan, using stable anatomical structures for alignment [25].
The data measurement method is illustrated in Fig. 5A. With the virtual implant as the center, parallel lines perpendicular to the implant were drawn at the implant shoulder and at 1 mm, 2 mm, 3 mm, 4 mm, and 5 mm below the shoulder. The distances between the intersection points of these lines with the contours of the T0, T1, and T2 scans and the virtual implant were measured, representing the thickness of the labial bone (LBT0-5). The difference in LBT between T1 and T0 was defined as the amount of bone graft (LBG0-5), the difference between T2 and T0 as the amount of new bone formation (LBF0-5), and the difference between T1 and T2 as the amount of bone resorption (LBR0-5) [26]. The distance between the intersection points of the contours of the T0, T1, and T2 scans on the labial and lingual sides represented the alveolar bone thickness (ABT0-5). The difference in ABT between T1 and T0 was defined as the amount of bone graft (ABG0-5), the difference between T2 and T0 as the amount of new bone formation (ABF0-5), and the difference between T1 and T2 as the amount of bone resorption (ABR0-5). The bone resorption rate (BRR) was calculated as BR / BG × 100%.
Fig. 5
Diagram of data measurement. A: Linear data measurement diagram. Contour lines: Red-T0 (preoperative), Green-T1 (postoperative), Blue-T2 (6 months postoperative); ab: labial bone thickness; bc: labial bone graft; bd: labial bone formation; cd: labial bone resorption; be: alveolar bone thickness; cf-be: alveolar bone graft; dg-be: alveolar bone formation; cf-dg: alveolar bone resorption. B: 3D volume measurement diagram. 3D reconstructed models: Red-T0 (preoperative), Green-T1 (postoperative), Blue-T2 (6 months postoperative); the white rectangular dashed box represents the region of interest (ROI). C: ROI0, the ROI of T0. D: ROI1, the ROI of T1. E: ROI2, the ROI of T2. F: ROI graft, the grafted bone area. G: ROI osteogenesis, the new bone formation area. H: Pink: 3D reconstructed model of the grafted bone; Yellow: 3D reconstructed model of the new bone
Three-dimensional radiographic evaluationThe DICOM files from the T0, T1, and T2 CBCT scans were imported into Mimics software (Mimics 20.0, Materialise, Leuven, Belgium) and reconstructed using the same bone tissue threshold. Stable anatomical structures were used to align the three reconstructions (Fig. 5B). A region of interest (ROI) was selected as a rectangular box on the 3D model reconstructed from the T1 scan. The corresponding ROI areas from T0 to T2 were then reconstructed to obtain ROI0, ROI1, and ROI2 (Fig. 5C-E). A Boolean operation between ROI1 and ROI0 defined the grafted bone area (ROI graft) (Fig. 5F, H), and a Boolean operation between ROI2 and ROI0 defined the new bone formation area (ROI osteogenesis) (Fig. 5G, H). Osteogenic efficiency (OE) was calculated as OE = new bone formation / grafted bone × 100% = (VT2 − VT0) / (VT1 − VT0) × 100%.
Outcome variablesThe primary outcome was LBF0. Secondary outcomes included LBF1-5, ABF0-5, BRR0-5, OE, and the incidence of complications.
Sample sizeThe sample size was calculated using PASS software (PASS 15, NCSS, LLC, Kaysville, UT, USA). In this study, the labial thickness of hard tissue at the implant shoulder level (LBT0) was considered the primary outcome. Based on the study by Benic [16], a standard deviation of 0.80 mm was assumed. Given a significance level of α = 0.05 (Type I error) and a power of β = 0.20 (Type II error), a clinically relevant intergroup difference of 1 mm [27] was considered. Allowing for a 20% dropout rate, the required sample size was calculated to be 24 patients (12 patients per group).
Statistical methodsStatistical analysis was performed using SPSS 26.0 software (IBM Company, Armonk, New York, NY, USA). Descriptive statistics were used to summarize the data. Numerical data were reported as means and median, and nominal data as frequencies. The Shapiro–Wilk test was used to assess normality. For statistical comparisons of graft augmentation, bone augmentation, and bone resorption, the independent samples t-test was used for normally distributed data, Welch's t-test was applied when variances were unequal, and the Mann–Whitney U test was applied for non-normally distributed data. To improve the robustness of statistical inference of small samples, Bootstrap resampling technique (1000 times) was used for evaluation, and confidence intervals were generated to enhance the reliability of the results. Fisher's exact test was used to analyze the nominal data. All hypothesis tests were conducted at a 5% significance level.
Comments (0)