
Remember me

The protonable cationic lipid ALC-0315, DSPC, cholesterol and DMG-PEG2000 were purchased from Shanghai Aiwei Top Pharmaceutical Technology Co., Ltd. Ethanol and phosphotungstic acid were obtained from Zhongphenol Chemical Reagent Co., Beijing, China. SARS-CoV-2 S-mRNA was obtained from CanSino Biologics Inc. DMEM, fetal bovine serum, and penicillin streptomycin were purchased from Thermo Fisher Scientific. Glucose, sucrose, trehalose, lactose, mannitol and nuclease-free water were obtained from Tianjin Jiangtian Chemical Co., Ltd. The RiboGreen kits and ELISA kits were from CanSino Biologics Inc.
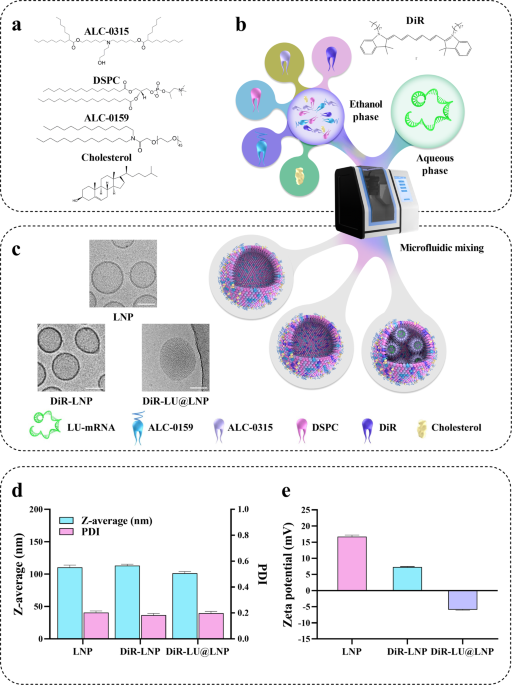
Preparation of mRNA-LNPsLNPs were prepared by microfluidic mixing using the NanoAssemblr Benchtop (Precision Nanosystems, Vancouver, Canada). An ethanolic phase containing lipids was mixed with an acidic aqueous phase (25 mM sodium acetate, pH 4.0) containing mRNA (135 µg/mL) leading to the formation of LNPs19. LNPs were produced at a flow rate ratio (aquaous: organic) of 3:1 and a total flow rate of 4.0 mL/min44. Ionizable cationic lipid ALC-0315: DSPC: cholesterol: DMG-PEG2000 were used in molar ratio of 49:10:39.5:1.5 to prepare mixed lipid ethanolic phase. Immediately after production, LNPs were dialyzed against an excess of phosphate buffered saline using Slide-a-Lyzer™ dialysis cassettes G2 with a membrane cutoff of 20 kDa for 16–24 h. After dialysis, LNPs were sterilized using 0.22 μm PVDF membrane filters and concentrated to an appropriate volume using Amicon® Ultra-15 centrifugational filter units with a membrane cutoff of 10 kDa at 500–1500 × g at 4 °C. Purified LNP was kept at 4 °C and used within 7 days after production44.
mRNA-LNPs lyophilizationSARS-CoV-2 mRNA was encapsulated in mRNA-LNPs containing one or more protective agents, such as lactose, sucrose, trehalose, mannitol and glucose. The mRNA-LNPs were then lyophilized by a vacuum freeze-dryer. The lyophilization cycle was divided into three processes as follows: pre-freezing, primary drying, and secondary drying. At the end of the cycle, the sample was placed under atmospheric pressure, plugged with a stopper, and transferred to a different storage temperature for stability monitoring. All samples were lyophilized, which produced a dense white lyophilized powder45.
Experimental design and statistical modelingBecause the protective agent selected through the pre-test had a poor effect and large particle size, the protective agent needed to be optimized. Thus, we selected sucrose, trehalose, and mannitol as the optimal lyophilized protective agents in the present study. We used the applied mathematical technique of statistical modeling to optimize the lyophilized protective agent considering the influencing factors, and the maximum response with relative significance was obtained. Design Expert 13 software was used to design three levels of three factors as well as to design different doses of protective agents for screening. Statistical Packaging Design Specialist (Version 7.0.0, STAT Ease, Inc., Minneapolis, MN, USA) was used to analyze experimental data and generate regression equations as well as to determine optimal parameters and surface diagrams from response fit plots.
Rehydration of lyophilized mRNA-LNPsAfter adding nuclease-free water to the total mRNA with the target concentration of 0.5 mg/mL, the lyophilized product was quickly rehydrated within 10 s. When nuclease-free water was added, a transparent liquid with blue opalescence was obtained quickly after gently turning the vial several times to entirely and evenly mix the sample.
Moisture content analysisIn total, 0.1 g lyophilized product was placed into a 831KF Coulometer (Metrohm, Switzerland) to measure the moisture content of the lyophilized sample.
Morphological study of the lyophilized and rehydrated mRNA-LNPsThe lyophilized and rehydrated mRNA-LNPs were diluted to an appropriate concentration with phosphate buffer, and the sample (10 μL) was placed on a copper net. After 5 min, the samples were stained with 2% phosphotungstic acid and detected by transmission electron microscopy (TEM). Samples for scanning electron microscopy (SEM) imaging were prepared, and an appropriate amount of lyophilized mRNA-LNPs was added onto conductive gel for gold spray treatment and then examined by SEM. Particle size measurements were performed by dynamic light scattering (DLS) after rehydration of the lyophilized product.
Determination of the stability of lyophilized mRNA-LNPsThe stability of lyophilized mRNA-LNPs stored at different temperatures ranging from 2 to 40 °C for one month was determined46,47, and the stability of lyophilized mRNA-LNPs was also determined for storage at 2–8 °C for 4 months. The particle size was measured with a DLS instrument on Days 1, 3, 7, 10, 14, and 30.
mRNA encapsulation efficiencyWe determined and compared the encapsulation efficiency of lyophilized mRNA-LNP ssamples and non-lyophilized samples stored at 2–8 °C for one month48. Evaluating mRNA encapsulation efficiency through quantitative RiboGreen assay49, which determined the concentration of free and total S-mRNA in LNPs according to the manufacturer’s instructions50. The RNA in the LNPs formulation was quantified using the standard curve generated by the corresponding diluted RNA reserve sequence. Both standard and sample were diluted with 1x Tris-EDTA (TE) buffer at pH 8.0, and the target concentration of the final sample was 0.1 ng/μL. Fluorescence was determined using a spectral fluorescence photometer (Varian Cary Eclipse) at an excitation of 500 nm and emission of 525 nm. The standard curve was calculated by linear regression analysis of fluorescence intensity and standard concentration. The RNA encapsulation rate of LNPs samples was determined by comparing the signals of the RiboGreen RNA-bound fluorescent dye in the absence and presence of membrane permeabilization reagent (0.1% Triton X-100). In the absence of a membrane permeabilization reagent, the signal is emitted only from unencapsulated RNA, whereas in the presence of a membrane permeabilization reagent, the signal is emitted from total RNA, including both coated and uncoated RNA51. The following formula was used to calculate the encapsulation rate:
$$}\; }\, \% =\frac}}_}}\,-\,}}_}}}}}_}}}\times 100 \%$$
mRNA integritymRNA integrity was measured by capillary electrophoresis using an Agilent 5200 Fragment Analyzer and the Agilent HS RNA Kit (DNF-472-1000). At each time point, LNP samples were treated with Triton X-100 to disrupt the particles, diluted to 0.0025 mg/mL, mixed with the marker diluent, and then heat denatured at 70 °C for 2 min. The unformulated RNA payloads were treated in exactly the same manner. The Fragment Analyzer injected the sample at 7 kV for 150 s with separation at 8 kV for 45 min. Data from each run were analyzed using PROSize 3.0 software. RNA integrity of the formulated mRNA-LNP sample is presented as the percentage relative to the unformulated mRNA standard assayed within the same run.
Cell cultureHuman embryonic kidney cells (HEK293) were donated by Prof. Tao Zhu from Tianjin University of Science and Technology and provided by CanSino Biologics Inc. (Tianjin, China). HEK293 cells were cultured in DMEM containing 10% (v/v) fetal bovine serum (FBS) in a humid atmosphere of 37 °C and 5% CO2.
In vitro cytotoxicity of lyophilized mRNA-LNPsThe cell viability after treatment with lyophilized mRNA-LNPs and non-lyophilized mRNA-LNPs was evaluated by a MTT assay. In brief, 5×10⁴ HEK-293 cells per well were seeded into a transparent 96-well plate. After 24 h of culture, lyophilized samples and non-lyophilized samples (0.5, 1, 1.5 and 2 μg/mL mRNA concentration) were added followed by incubation at 37 °C and 5% CO2 for 24 h. Then, 10 μL of nuclease-free water and 90 μL of complete medium were mixed and added to the wells. After 24 h, 20 μL of MTT was added to each well followed by incubation at 37 °C and 5% CO2 for 3 h. The cell culture medium was removed, and 200 μL of DMSO was added to dissolve the crystals with shaking for 20 min. A microplate reader was used to measure the absorbance at 570 nm, and the background value measured at 680 nm was used for calibration. The average percentage of living cells compared to untreated cells represented 100% viability.
Western blot analysisThe expression of mRNA-LNPs was analyzed by western blot analysis. Whole-cell lysates and supernatants were combined with a loading buffer containing dithiothreitol, separated by 10% SDS-PAGE, and transferred onto a polyvinylidene difluoride (PVDF) membrane using a semidry blotting apparatus (15 V and 60 min). The membrane was blocked with nonfat milk in a PBS buffer containing 0.5% Tween-20. Samples were incubated with a primary antibody (SARS-CoV-2 S1 polyclonal antibody at 0.1 µg/mL, CanSino Biologics, China) for 1.5 h followed by incubation with a secondary goat anti-rabbit IgG-HRP for 45 min. The membrane was incubated with a western blot substrate (Solarbio, China), and images were acquired using an ECL system (CLINX, China).
AnimalsFemale BALB/c mice aged 6–8 weeks and weighing 18–22 g were used in the experiment. The protocols and procedures used in animal experiments were reviewed and approved by the Ethics Committee of CanSino Biologics Inc. (Tianjin, China).
In vivo immune effectRehydrated lyophilized mRNA-LNPs and non-lyophilized mRNA-LNPs (50 μL) were intramuscularly injected into BALB/c mice for immune efficacy comparison, and the mice were randomly divided into five groups (four groups for lyophilized mRNA-LNPs of different freeze drying procedure, one group for non-lyophilized mRNA-LNPs). Serum samples were collected on Days 14 and 28 after primary immunization to detect SARS-CoV-2 specific IgG and neutralizing antibody responses.
Epitope-specific antibody titers were detected by a semi-quantitative enzyme-linked immunosorbent assay (ELISA). Briefly, recombinant SARS-CoV-2 RBD protein (2.0 μg/mL) was coated on a 96-well high-binding polystyrene assay plate. After incubating overnight at 4 °C, plates were blocked with 2% bovine serum albumin (BSA) for 4 h at room temperature and washed three times with wash buffer. Subsequently, serial dilutions of the sera samples were added and incubated overnight at 4 °C. After washing five times with wash buffer, goat anti-mouse IgG-HRP (1:50000 dilution) was added to the plate and incubated for 2 h at 37 °C. The trimethyl borane (TMB) solution (Solarbio) was added, and the plates were incubated for 30 min in the dark. Finally, 2 M H2SO4 was applied to stop the reactions, and the absorbance at 450 nm was acquired using an ELISA reader.
Molecular dynamics simulationsAccording to the formulation, DSPC, DSPE, sucrose and cholesterol were selected for molecular dynamics simulations (Fig. 9A, B). The software used for the molecular dynamics simulations was GROMACS 2020.652, and Charmm-Gui was used to build two all-atomic models, in which phospholipid molecules, sucrose molecules, trehalose molecules, phospholipid type, DSPC amount, DSPE amount and cholesterol amount were added in proportion53. Due to the need to simulate the state of LNPs after lyophilization, we constructed the following two systems: an aqueous system and an anhydrous system (Fig. 9C–F). The aqueous system included a TIP3P water molecule model. Both atomic models were placed in a box (size of 10 nm × 10 nm × 10 nm) with periodic boundary conditions. In addition to phospholipids and lyoprotectants, the remaining water molecules filled the box in the aqueous system. The cut-off radius of the Lennard Jones and van der Waals interaction was 1.4 nm. The step method reduced the energy of all atomic models to 1000 steps. Finally, the model was simulated with 10 ns molecular dynamics. All atomic models were equilibrated in situ at 0.5 ns and 1 atm pressure of 303.15 K (NPT and NVT). For both systems, the simulations were performed at constant temperature and volume (NVT), and periodic boundary conditions were applied to stabilize the simulated space. The force field used was CHARMM 36. The resulting analysis included the electrostatic effect, van der Waals effect, total energy, number of hydrogen bonds, density, radial distribution function (RDF), solvent accessible surface area (SASA), root mean square deviation (RMSD), radius of gyration (RG), and mean square displacement (MSD)46. These analyses helped investigate the protection mechanism of the sugar agents during the lyophilization of phospholipids, and an energetic analysis of the system was performed to determine the stability of the phospholipid structure.
Fig. 9: All-atom models.
A All-atom models of the phospholipid bilayer composed of three phospholipids, namely, DSPC, DSPE and cholesterol. B All-atom models of sucrose and trehalose with the polyglycan modeler. C Molecular dynamics morphology after equilibrium in anhydrous system. D The molecular dynamics morphology was simulated for 10 ns in an anhydrous system. E Molecular dynamics morphology after equilibrium in an aqueous system. F The molecular dynamics morphology of an aqueous system was simulated for 10 ns (yellow beads indicate NaCl molecules used in equilibrium).
Reporting summaryFurther information on research design is available in the Nature Research Reporting Summary linked to this article.
Comments (0)