Study design and ethical approval
This study was a prospective controlled study and approved by the Ethics Review Committee of the First Affiliated Hospital (Southwest Hospital) of the Third Military Medical University (Ethical batch No. (A)KY202221). Informed consent was obtained from all patients prior to their participation in the study.
Patients
According to the research needs, we referred to a previous basic research and relevant literature. A total of 6 patients who were diagnosed with ADS and hospitalized in our department were assessed. The inclusion criteria was age > 50 years (including), Cobb angle ≥ 10° on the coronal plane of the full-length X-ray film of the spine, with surgical indications. The relevant preoperative examination results indicated no absolute surgical contraindications, and the patients were deemed ready for posterior scoliosis correction, bone grafting, and internal fixation under general anesthesia. Meanwhile, 6 patients with simple lumbar spondylolysis were designated as the control subjects. The inclusion criteria for this group was age 20–40 years (including) and without scoliosis, lumbar spondylolisthesis, instability, and no obvious degeneration of the intervertebral disc on imaging, and no absolute surgical contraindications. The subjects willingly underwent posterior pedicle spondylolysis bone grafting and screw rod system internal fixation under general anesthesia. The medical records of these patients and their PVM tissue samples during the surgical operation were collected.
Collection and processing of the PVM samples
After inducing the general anesthesia, the patient were set to the prone position and their lumbar bridge was adjusted. We took the median incision in accordance with the conventional posterior approach, peeled off the PVM on both the sides of the spinous process and along the subperiosteal, fully exposed the screw entry points of the pedicle screws, accurately placed the screws under X-ray monitoring, and then performed spinal canal decompression, bone graft fusion, and orthopedic surgery.
Because the transverse process retractor/automatic retractor was required to be used to pull the paravertebral muscle to both sides during the operation in order to fully expose the operation area, repeated operations during the operation inevitably led to a partial tearing of the PVM. In addition, the operation time was long, which inevitably led to partial PVM ischemia. In order to avoid muscle necrosis affecting the wound healing, such PVM was routinely removed. Therefore, we took the abovementioned PVM tissue samples (approximately the size of soybeans, with a diameter of ≤ 0.5 cm) from each selected case, filled in the sample collection registration form in detail, cleaned the tissue samples with normal saline, placed into a sterile centrifuge tube, and immediately placed them into a liquid nitrogen tank for 10–20 s of quick freezing, wrapped with aluminum foil, and then placed into a -80℃ refrigerator for storage.
Proteomic detection and analysisExtraction and digestion of protein
Use SDT buffer (4% SDS, 100 mM Tris HCl, 1 mM DTT, pH7.6) to lysis the sample and extract the protein, and use BCA Protein Assay Kit (Bio-Rad, USA) to quantify the protein. Trypsin was used to digest the protein according to the Filter-Aided Sample Preparation (FASP) procedure. Digested peptides from each sample were desalted on C18 Cartridges (Empore™ SPE Cartridges C18 (standard density), bed I.D. 7 mm, volume 3 ml, Sigma), concentrated by vacuum centrifugation, and reconstituted in 40 µl of 0.1% (v/v) formic acid.
SDS-PAGE
Mix 20 µg of protein from each sample with 5X loading buffer, and boil with boiling water for 5 min. 12.5% SDS-PAGE gel was used to separate proteins (constant current 14 mA, 90 min), and Coomassie Blue R-250 staining was used to observe the protein bands.
Labeling
iTRAQ: According to the manufacturer's instructions (Applied Biosystems), iTRAQ reagent is used to label 100 μg of peptide mixture from each sample.
TMT: According to the manufacturer's instructions (Thermo Scientific), the TMT reagent was used to label 100 μg of peptide mixture from each sample.
Strong cation exchange (SCX) fractionation
Use AKTA Purifier system (GE Healthcare) to separate the labeled peptides by SCX chromatography. Before the dried peptide mixture was applied to a PolySULFOETHYL 4.6 × 100 mm column (5 µm, 200 Å, PolyLC Inc, Maryland, U.S.A.), it was reconstituted and acidified with buffer A (10 mM KH2PO4 in 25% of ACN, pH 3.0). Peptides were eluted at a flow rate of 1 ml/min. The gradient was 0% buffer B (500 mM KCl, 10 mM KH2PO4 in 25% of ACN, pH 3.0) for 25 min, 0–10% buffer B for 25–32 min, 10–20% buffer B for 32–42 min, 20–45% buffer B for 42–47 min, 45–100% buffer B for 47–52 min, and 100% buffer B for 52–60 min. After 60 min, buffer B was reset to 0%. The elution was monitored by the absorbance at 214 nm, and the fractions were collected every 1 min. The collected fractions were desalted on C18 Cartridges and concentrated by vacuum centrifugation.
LC–MS/MS analysis
Q Exactive mass spectrometer (Thermo Scientific) is coupled with Easy nLC (Thermo Fisher Scientific) for LC–MS/MS analysis, and the analysis time is 60/90 min. The peptides were loaded onto the reverse phase capture column connected to the C18 reverse phase analytical column in buffer A (0.1% Formic acid) and separated using the linear gradient of buffer B (84% acetonitrile and 0.1% Formic acid), the flow rate is 300 nl/min and is controlled by IntelliFlow technology. The mass spectrometer operates in a positive ion mode.
Identification and quantitation of proteins
The MASCOT engine (Matrix Science, London, UK; version 2.2) embedded with Proteome Discoverer 1.4 software, which can be used for identification and quantitative analysis, is used to search the MS raw data of each sample.
Bioinformatic analysisCluster analysis
First, the quantitative information of proteome is normalized (normalized to (− 1,1) interval). Then use the Complexheatmap R package (version 3.4) to classify the two dimensions of samples and protein expression, and generate hierarchical clustering Heatmap.
GO function annotation
The target protein sets were annotated with Blast2GO, which can be roughly summarized into four steps: sequence alignment (Blast), GO entry extraction (Mapping), GO annotation (Annotation) and InterProScan annotation (Annotation Augmentation).
KEGG pathway annotation
The KEGG pathway of the target protein collection is annotated with KAAS (KEGG Automatic Annotation Server) software.
Enrichment analysis
The distribution of each GO classification (or KEGG pathway or Domain) in the target proteome and the whole proteome was compared using Fisher's exact test, and the target proteome was enriched with GO annotation or (or KEEG pathway or Domain) annotation. Only functional categories and pathways with p-values below 0.05 were considered significant.
Protein–protein interaction (PPI) analysis
Based on the information in the IntAct (http://www.ebi.ac.uk/intact/main.xhtml) or STRING databases (http://string-db.org/), the direct and indirect interaction relationship between target proteins is clarified, and the interactive network is generated and analyzed using the CytoScape software (version No. 3.2.1). In addition, the importance of each protein in the PPI network is evaluated by calculating the degree of each protein.
Establishment of the rat scoliosis model
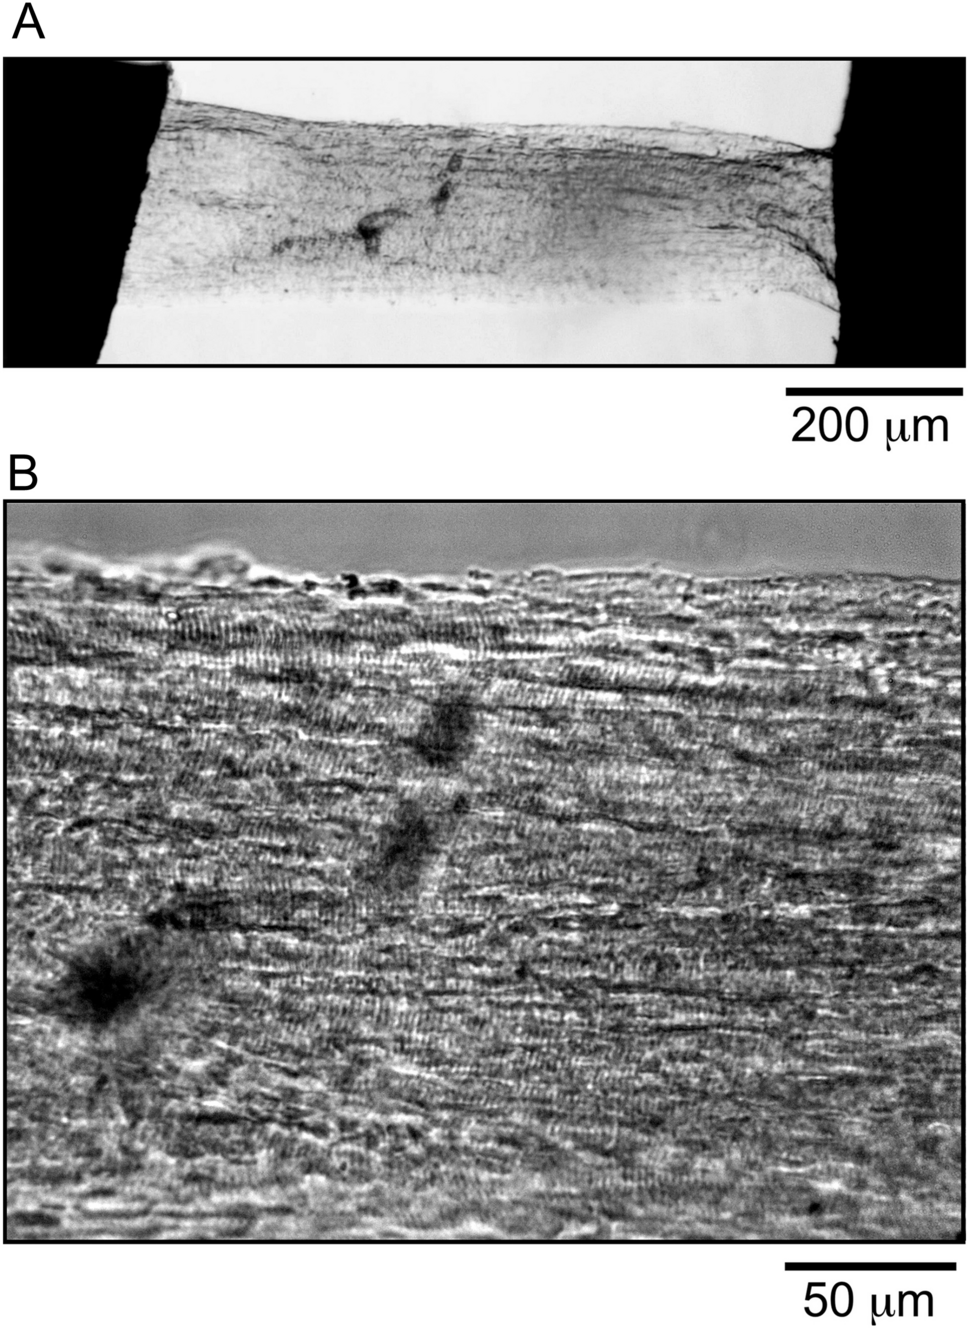
Because the volume of the PVM tissue samples collected was small, only proteomic analysis was performed. To determine the morphological changes of the PVM in scoliosis compared with those without scoliosis, we constructed a rat scoliosis model based on the research of Lifeng Liu et al. (1976). Nine 4-week old female Wistar rats weighing approximately 60 g were randomly assigned to 3 groups: Group 1 (the control group or the no scoliosis group that did not receive any treatment). Group 2 (the scoliosis group, which received anesthesia with isoflurane inhalation and involved tying with non-absorbable silk thread subcutaneously). In this group, the left subscapular angle and the ipsilateral iliac bone were tied to approximately 80% of the original subscapular angle to the ipsilateral iliac bone, which made the spine slightly right convex, after which the forelimbs were cut off to establish a bipedal rat model. Group 3 (also a scoliosis group, albeit the degree of tethering was approximately 60% from the original subscapular angle to the ipsilateral iliac bone, while the other treatment was the same as that of Group 2). All rats were raised independently. Group 1 used a standard cage, and Groups 2 and 3 used special high cages. After 8 weeks of tethering, the silk thread was cut and the rats were observed for 2 weeks. Next, the rats were executed, and the angle of scoliosis was evaluated by Micro-computed tomography (CT). The PVM was stained with HE staining, Oil red O staining, and Sirius red staining in accordance with the instructions of the Kit, and the morphology of the PVM was analyzed.
Immunofluorescence
The tissue sections were dewaxed, and then the citrate buffer antigen was repaired by microwave (92–96 ℃, 10–15 min), and then cooled to room temperature naturally. Clean with pure water, dry in circles, and wash with PBS for 3 times, 5 min each time. Use normal sheep serum to seal at 37 ℃ for 60 min, pour out the excess serum, drop the first antibody, and incubate at 4 ℃ overnight. Then rinse with PBS three times (5 min each time), add fluorescein labeled secondary antibody, incubate in dark at 37 ℃ for 60 min, and rinse with 0.01 M three times (5 min each time). The anti-quenching sealing agent is used to seal the tablet, and it is stored in a refrigerator at 4 ℃ away from light. Finally, the fluorescence microscope is used to observe and take photos.
Western blotting analysis
Radioimmunoprecipitation assay lysis buffer was used to extract the total protein of each group, and then the protein concentration was quantified by the bicinchoninic acid assay. 10% sodium dodecyl sulfate polyacrylamide gel electrophoresis was used to separate the Equivalent amounts of protein (20 mg) in each group, and then transferred onto 0.2 mm polyvinylidene fluoride membranes. The membranes were blocked in 3% BSA (containing 0.1% Tween 20) for 12 h and then blots were incubated (4 ℃ overnight) with primary antibodies against Myeloperoxidase (MPO) (1:1000, ABclonal Technology, China.) and GAPDH (1:2000, SanJian, China). After the membranes were washed with TBST, the secondary antibody (anti-rabbit IgG or anti-mouse IgG diluted at 1:5000) was used to incubated them at room temperature for 1 h. Use the Quantity One program and the Enhanced Chemiluminescence Kit (Amersham Biosciences, UK) to visually analyze the signals on the membranes.
Statistical analyses
The data were expressed in the form of mean ± standard deviation. Statistical analysis was conducted with two-way analysis of variance using the GraphPad Prism 7.0 statistical software package (GraphPad Software). p < 0.05 was considered to indicate statistical significance.


Comments (0)